NEAR Weekly Range Rebound: Price Drifts in Indecision

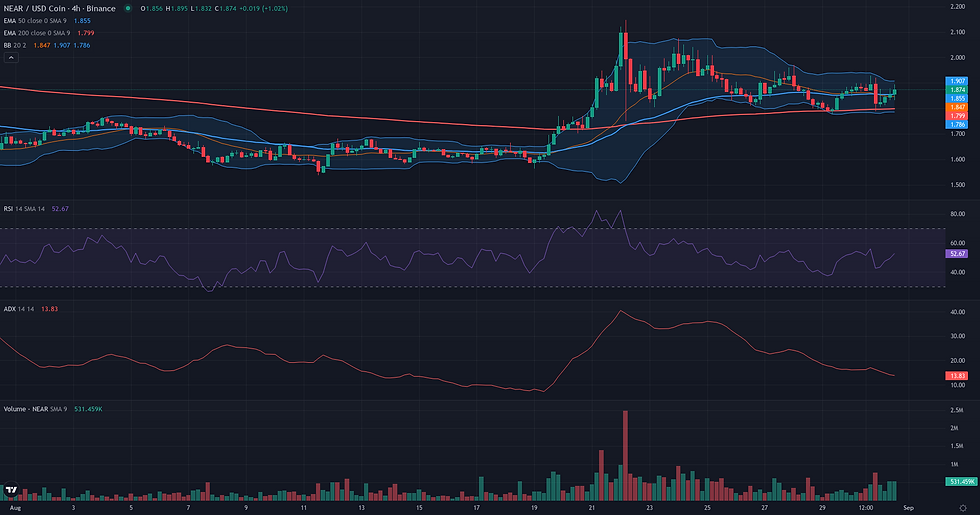
This NEAR weekly range rebound examines the current NEAR/USDC structure in the context of support defense and weakening alternative frameworks. NEAR/USDC is currently navigating a period of technical indecision, with its price consolidating around the 1.82 level after a notable pullback from the recent high of 2.15. The market structure presents a significant conflict between timeframes: the daily chart maintains a trending character, with an ADX of 25.18, while the weekly chart remains firmly in a non-trending, consolidative state, evidenced by a low ADX of 17.26. Price action is currently contained between key moving averages, including the D1 EMA50 at 1.80 and the D1 EMA200 at 1.76, reinforcing the sense of equilibrium. This technical indecision aligns with the latest fundamental analysis, which describes a period of price drift and a broader market sentiment that has shifted towards caution. With the daily RSI positioned neutrally at 51.38 and volume weakening on the recent decline, the market awaits a catalyst to resolve the ambiguity between the daily trend and the weekly range.

NEAR Weekly Range Rebound: Support and Friction Zones
The borderline Range/Rebound framework for NEAR/USDC now enters a critical resolution phase, centered on the 1.71 - 1.77 USDC validation zone. This area represents a significant structural floor, combining the D1 EMA 200 (1.76) and multiple daily and weekly pivot supports. The market's ability to stabilize here will determine the framework's viability. The immediate 4H context shows a state of equilibrium, with a neutral RSI (49.25) and a very low ADX (14.11), suggesting a pause in the recent pullback and a period of indecision. The invalidation of this rebound thesis is clearly defined: a daily close below 1.71 USDC. Such a move would breach the entire support confluence, signaling a failure to hold and likely triggering a continuation of the downtrend towards the prior structural low around 1.56. For the rebound to confirm, the price must overcome several layers of resistance. The first friction zone lies between 1.85 and 1.90, an area containing the daily and weekly pivots. Clearing this zone would be the first sign of strength. A more formidable obstacle is located at the 1.98 - 2.00 cluster, which includes the W1 EMA 50 and the W1 R1 pivot. If buyers successfully defend the validation zone and push through these friction levels, the primary projection zone is the recent daily high at 2.15 USDC. A stronger resolution could even test the W1 R2 pivot at 2.19. Confirmation of the rebound would be a D1 close above 1.90, while a weakening signal would be a failure to hold above the D1 EMA 50 at 1.80, causing the price to languish within the validation zone.

Breakout: Structural Catalyst Assessment
The Breakout framework is currently assessed as not plausible for NEAR/USDC. The primary reason for this verdict is the current market structure, which is characterized by a corrective pullback rather than the necessary pre-breakout compression. While a strong upward impulse recently established a clear and significant resistance zone between the weekly high of 2.08 and the Donchian upper band at 2.15, the price action since has been one of rejection. Instead of coiling tightly beneath this ceiling, the price has retreated towards the D1 EMA 50 at 1.80. This structural weakness is compounded by a lack of supportive secondary signals. Momentum is neutral, with the D1 RSI at 51.38, and the D1 Volume Oscillator is negative at -8.52, indicating that recent trading activity lacks the conviction required for a structural break. Furthermore, the weekly context adds friction; the W1 ADX at 17.26 points to a non-trending environment, and a recent attempt to overcome the W1 EMA 50 at 1.98 appears to have failed. For the Breakout framework to become relevant, the market would need to halt its decline and build a new, sustained consolidation base directly under the 2.08-2.15 resistance, accompanied by a clear resurgence in both volume and directional momentum.

Continuation: Directional Flow Assessment
The technical structure for NEAR/USDC presents a borderline case for a bullish continuation. The primary supporting element is a well-defined daily impulse-correction pattern. A strong upward move from mid-August peaked at 2.15, establishing clear bullish intent. The subsequent price action has been a corrective pullback, which has so far found support within a critical zone defined by the D1 EMA50 (1.80) and D1 EMA200 (1.76). This defense of key moving averages, coupled with lower volume during the correction, suggests the pullback may be a pause within a larger uptrend. However, this daily view is tempered by a less convincing weekly context. The weekly chart indicates a broader ranging market, with an ADX of 17.26 signaling a lack of a dominant trend. Furthermore, the price remains below the W1 EMA50 at 1.98, a level that could pose significant resistance. This tension between a constructive daily setup and a neutral weekly backdrop is what makes the continuation framework borderline rather than fully plausible.

Comparative Framework Verdict
A comparative analysis of the three technical frameworks reveals a market at a crossroads, with no single scenario being decisively dominant. The Breakout framework is currently rated as not plausible. The recent price action was a clear rejection from the 2.15 resistance, leading to a pullback rather than the necessary compression and volume buildup required to support a potential breakout. This leaves two competing, borderline-plausible scenarios: the Range/Rebound and the Continuation. The Continuation framework is based on the constructive daily impulse-correction pattern, viewing the current pullback as a healthy pause before the next leg up. However, its plausibility is limited by the non-trending weekly context. In contrast, the Range/Rebound framework aligns more closely with this broader weekly picture, focusing on the potential for price to stabilize and find support within a critical confluence zone between 1.71 and 1.77. Given its grounding in the higher timeframe structure and its well-defined validation zone, the Range/Rebound framework is considered marginally dominant, with the Continuation as a close secondary possibility. The resolution between these two views hinges on the market's reaction to the 1.71-1.77 support area. A successful defense of this zone would strengthen the range-bound thesis, while a breakdown would invalidate both bullish frameworks and suggest a deeper correction.
For broader market context, readers can also review the latest related fundamental analysis for this pair.
For live market monitoring and the full interactive chart, readers can access the dedicated NEAR Market Hub.
Disclaimer
CopyTradia provides technical analysis for informational and educational purposes only. This content does not constitute financial advice, investment recommendations, or trading signals. Cryptocurrency markets are highly volatile. Past performance is not indicative of future results. Always conduct your own research (DYOR) and consult a qualified financial advisor before making any investment decisions.


