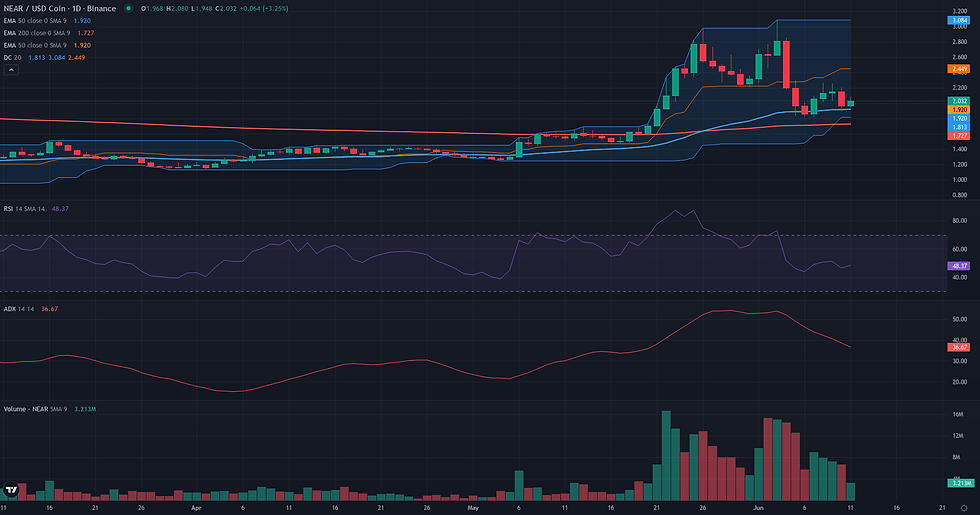
NEAR Range Rebound Analysis: Support Holds Near D1 EMA 200
- CopyTradia Intelligence

- 2 days ago
- 4 min read
This NEAR range rebound analysis examines the current NEAR/USDC structure in the context of support defense and weakening alternative frameworks. NEAR/USDC is currently in a phase of technical consolidation after a volatile period that saw the price fall from a weekly high of 3.08 to a low of 1.81. The price is now pivoting around the 1.97 level, caught between key moving averages, with the D1 EMA 200 providing support at 1.72 while the W1 EMA 50 acts as resistance at 2.05. Daily momentum indicators reflect this indecision; the RSI at 46.60 remains below the neutral 50 mark, while the ADX at 38.60 indicates that the preceding downward trend was powerful and may not be fully exhausted. This technical consolidation follows a period of elevated volatility and a shift in market sentiment, as noted in recent fundamental analysis, suggesting the market is now seeking equilibrium after a sharp directional move. The current structure presents a conflict between potential stabilization at a major support level and the lingering effects of the recent sharp rejection from the highs.

NEAR Range Rebound Analysis: Support and Friction Zones
The Range/Rebound framework for NEAR/USDC hinges on the defense of the [1.72, 1.81] validation zone, an area of confluent support defined by the D1 EMA 200 and recent price lows. The resolution from this zone will determine if a technical rebound can materialize or if the prior downtrend will resume. The 4H chart shows a state of equilibrium, with a low ADX (15.11) indicating a pause in directional momentum, which is a necessary precondition for a reversal. The path to confirmation is not without obstacles. The first significant friction point is the W1 EMA 50 at 2.05, which is currently capping price action. Should buyers overcome this level, a more substantial resistance cluster awaits between the D1 R1 pivot at 2.15 and the W1 Pivot at 2.32. Clearing this area would strongly support the rebound scenario. If the framework confirms, a logical technical projection would be the W1 R1 pivot at 2.82, which served as a structural reference before the recent high. Conversely, the framework would lose coherence if the validation zone fails. A daily close below the D1 EMA 200 at 1.72 would invalidate the rebound thesis, signaling a structural breakdown. A weakening of the framework would be indicated by a failure to hold the D1 EMA 50 at 1.92 and a drop below the D1 S1 pivot at 1.84, suggesting that buying pressure is fading and the support is under critical threat.


Breakout: Structural Catalyst Assessment
The Breakout framework is currently not plausible for NEAR/USDC. The market structure is defined by a recent and decisive rejection from the key resistance zone around 3.08 USDC, which corresponds to the 20-day Donchian channel upper boundary. Instead of consolidating beneath this level in preparation for a potential break, the price has entered a sharp corrective phase, falling significantly from its peak. This downward price action is supported by momentum indicators; the daily RSI has fallen below the neutral 50 mark to 46.60, and the ADX at 38.60 confirms the strength of this recent downtrend. On the weekly timeframe, the picture is similarly unsupportive, with the last completed candle forming a classic rejection pattern with a long upper wick. For a Breakout scenario to become relevant, the current downward pressure would need to cease, followed by the price re-establishing itself and building a new consolidation structure directly beneath the 3.08 USDC resistance.
Continuation: Directional Flow Assessment
The Continuation framework is currently not plausible for NEAR/USDC. While the market recently demonstrated a strong bullish impulse, rallying from approximately 1.50 to a high of 3.08 in late May and early June, the subsequent price action has invalidated the core 'Stable Directional Flow' signature required for this strategy. The primary issue is the character of the pullback: instead of an orderly consolidation, the price experienced a sharp and deep retracement of over 40%, falling to a low of 1.81. This violent rejection suggests a potential trend reversal rather than a healthy pause. This structural breakdown is corroborated by momentum indicators, with the Daily RSI having fallen to 46.60, below the crucial 50 level that separates bullish from bearish regimes. Furthermore, the weekly context provides strong contradictory evidence; the last closed weekly candle formed a prominent bearish rejection wick after hitting the 3.08 high, and the price is now struggling below the weekly EMA50 at 2.05. For a continuation scenario to become relevant again, the price would first need to establish a clear higher low and then reclaim key structural levels, such as the weekly pivot at 2.32, with renewed momentum.

Comparative Framework Verdict
Comparing the three strategic frameworks, the analysis reveals a clear hierarchy with one dominant scenario. The Range/Rebound framework is deemed plausible, anchored by the defense of a critical support zone between 1.72 and 1.81. This area represents a confluence of the D1 200-period EMA and recent price lows. The plausibility of a rebound is supported by signs of selling pressure exhaustion, such as a bullish cross in the D1 Stochastics from oversold territory. This scenario suggests the market may be attempting to establish a local bottom after its sharp decline. In stark contrast, both the Breakout and Continuation frameworks are assessed as not plausible. Their invalidation stems from the same root cause: the decisive and sharp rejection from the 3.08 resistance level. This price action did not constitute a pre-breakout consolidation but rather a structural breakdown that invalidated the prior bullish trend. The loss of momentum, confirmed by the daily RSI falling below 50, makes any immediate bullish continuation or breakout scenario technically incoherent. Consequently, the market's immediate direction appears to hinge on the outcome of the Range/Rebound scenario. The key element to monitor is whether the support zone around the D1 EMA 200 can successfully absorb the recent selling pressure and serve as a foundation for a recovery.
For broader market context, readers can also review the latest related fundamental analysis for this pair.
For live market monitoring and the full interactive chart, readers can access the dedicated NEAR Market Hub.
Disclaimer
CopyTradia provides technical analysis for informational and educational purposes only. This content does not constitute financial advice, investment recommendations, or trading signals. Cryptocurrency markets are highly volatile. Past performance is not indicative of future results. Always conduct your own research (DYOR) and consult a qualified financial advisor before making any investment decisions.

Comments