NEAR Market Structure Analysis: Flux After Weekly Reversal
- CopyTradia Intelligence

- 5 days ago
- 4 min read
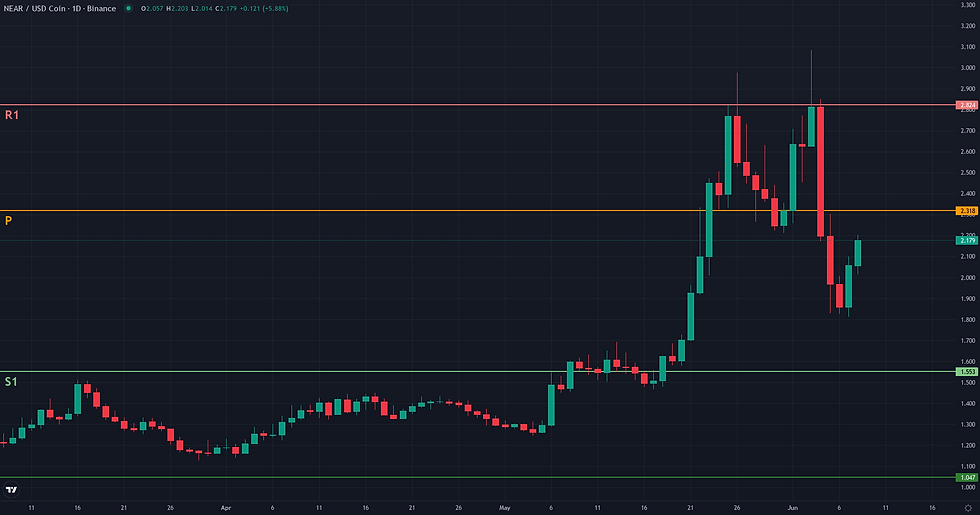
This NEAR market structure analysis examines the current NEAR/USDC structure in the context of support defense and weakening alternative frameworks. NEAR/USDC is currently navigating a period of significant technical uncertainty following a sharp rejection from the $3.08 weekly high. The price has since retraced to close around $2.06, erasing a substantial portion of its recent gains and neutralizing its momentum profile, as evidenced by a D1 RSI reading of 48.99. Despite this neutral momentum, the D1 ADX remains high at 43.92, indicating that the recent downward move was powerful and decisive, not a gradual slowdown. The market is now contending with a wide weekly range between $1.81 and $3.08, with price action consolidating near the 50-week EMA at $2.05. This sharp technical reversal aligns with the fundamental context of elevated volatility and a shift in speculative positioning, as increasing market-wide fear appears to have catalyzed the recent sell-off. The current structure lacks a clear directional bias, placing the asset at a critical juncture where neither a clear trend nor a stable range has been established.
NEAR Market Structure Analysis: Technical Framework Assessment
The Range/Rebound framework is currently not plausible for NEAR/USDC. The market structure is defined by a strong directional move rather than the stabilization required for this strategy. The primary contradiction comes from the D1 ADX, which at 43.92 signals a powerful ongoing trend, clashing with the framework's search for a controlled slowdown. Structurally, the price action is not a range but a sharp rejection from the 3.08 high, culminating in a drop to 1.81. This V-top reversal, confirmed by a deeply bearish weekly candle, suggests that sellers retain control and that the recent lows are being tested under pressure, not as part of a balanced consolidation. While the D1 Stochastic is oversold at 10.97, this isolated signal is insufficient to counter the weight of evidence pointing to a trending environment. For the Range/Rebound framework to become relevant, the market would first need to neutralize this bearish momentum, evidenced by the ADX falling below 25, and then establish a clear and sustained period of horizontal price action.

Breakout: Structural Catalyst Assessment
The Breakout framework is currently not plausible for NEAR/USDC. The market structure is not one of compression or preparation below resistance, but rather one of sharp rejection from a key ceiling. Price recently reached a 20-day high at 3.08, a level that also corresponds to the weekly high, but was immediately met with intense selling pressure, leading to a rapid decline to as low as 1.81. This price action has formed a prominent 'shooting star' candle on the weekly chart, a classic technical signal of a potential top and reversal. The loss of bullish impetus is further evidenced by the D1 RSI, which has fallen from overbought conditions to a neutral reading of 48.99. While the D1 ADX is high at 43.92, this value reflects the strength of the recent sell-off rather than a building bullish trend. For a breakout scenario to become relevant again, the price would need to stabilize and build a new consolidation structure below the 3.08 resistance, allowing momentum to rebuild.

Continuation: Directional Flow Assessment
The Continuation framework is assessed as not plausible for NEAR/USDC at this time. While the asset experienced a powerful upward impulse from mid-May to a peak of 3.08, the subsequent price action has broken the character of a stable continuation. The primary reason for this verdict is the nature of the recent pullback. Instead of a controlled consolidation, the market saw a sharp, high-volume rejection from the highs, culminating in a weekly candle with a long upper wick—a classic sign of significant selling pressure and potential trend exhaustion. This violent drop is reflected on the daily chart, where price fell from 3.08 to 1.81 in just a few sessions. Although the price is currently finding support near the D1 EMA50 (1.89) and W1 EMA50 (2.05), the momentum profile offers little support for an immediate resumption of the trend. The D1 RSI has reset to a neutral 48.99, indicating the bullish drive has dissipated rather than merely paused. For this framework to become relevant again, the market would first need to demonstrate an ability to absorb this recent distribution by building a stable consolidation base above these key moving averages and eventually reclaiming the weekly pivot at 2.32.

Comparative Framework Verdict
In this week's NEAR technical analysis, all three strategic frameworks are assessed as not plausible, reflecting a market structure that has been disrupted by a sharp bearish reversal. The recent, violent rejection from the $3.08 level has invalidated the conditions required for a stable range, a bullish breakout, or an orderly trend continuation. The Continuation framework is deemed invalid because the pullback from the highs was not a controlled consolidation but a rapid sell-off. This move, which formed a bearish 'shooting star' on the weekly chart, completely reset bullish momentum, as seen in the D1 RSI falling to a neutral 48.99. Similarly, the Breakout framework is not applicable. Instead of compressing below resistance in preparation for an upward move, the price was decisively repelled, signaling seller dominance. Finally, the Range/Rebound scenario is also unsuitable. The primary contradiction is the high D1 ADX of 43.92, which points to a strong trending environment—currently bearish—rather than the low-momentum, sideways action characteristic of a trading range. With no single framework providing a coherent narrative, the market for NEAR/USDC is in a transitional state. The key element to monitor is whether the price can absorb the recent selling pressure and build a new consolidation structure above key supports like the $1.89-$2.05 zone, or if bears will capitalize on the recent reversal.
For broader market context, readers can also review the latest related fundamental analysis for this pair.
For live market monitoring and the full interactive chart, readers can access the dedicated NEAR Market Hub.
Disclaimer
CopyTradia provides technical analysis for informational and educational purposes only. This content does not constitute financial advice, investment recommendations, or trading signals. Cryptocurrency markets are highly volatile. Past performance is not indicative of future results. Always conduct your own research (DYOR) and consult a qualified financial advisor before making any investment decisions.

Comments