NEAR Range Rebound Analysis: Support Holds at $1.82

This NEAR range rebound analysis examines the current NEAR/USDC structure in the context of support defense and weakening alternative frameworks. NEAR/USDC is currently navigating a period of deep consolidation, characterized by a lack of directional momentum and price action confined within a well-defined range. The daily ADX reading of 8.56 confirms an extremely weak trend, suggesting the market is in a state of equilibrium rather than preparing for a directional move. With the daily RSI at 43.56, momentum remains subdued and slightly bearish. Price is currently testing a significant structural floor, hovering just above the 200-day EMA at $1.82 after finding support at the weekly low of $1.78. This technical picture of a non-trending, range-bound market aligns with the latest fundamental context, which highlights a period of reduced volatility and a cautious environment for the asset. This analysis will explore three potential frameworks—Range/Rebound, Breakout, and Continuation—to assess the most probable structural scenarios for the week ahead.
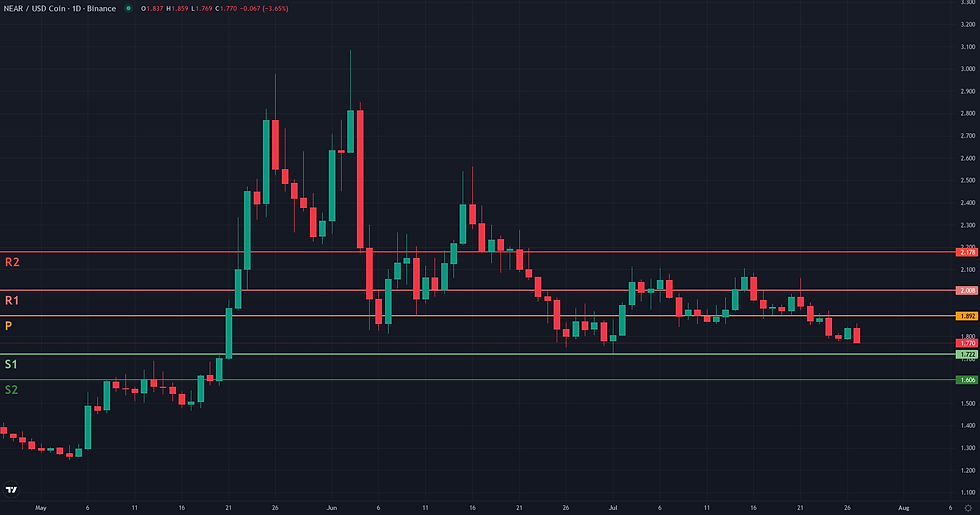
NEAR Range Rebound Analysis: Support and Friction Zones
Following the plausible Range/Rebound framework established from the validation zone of 1.78 - 1.82, the resolution path for NEAR/USDC is framed by clear structural levels. The integrity of this rebound scenario hinges on the stability of the range floor. An invalidation of the framework would occur with a decisive breakdown, specifically a daily close below the recent support cluster of 1.72-1.75. Such a move would negate the range-bound thesis and suggest a new leg down. Assuming the support holds, the path to the upper range is layered with notable friction zones. The first significant obstacle is the D1 EMA 50 at 1.94, which has historically acted as a dynamic mid-range equilibrium point. A failure to clear this level would cap the rebound attempt. Should the price overcome this, a more substantial resistance cluster awaits around 2.01-2.03, an area defined by the weekly R1 pivot and the W1 EMA 50. This zone represents a major test of buyer conviction. If the rebound successfully navigates these hurdles, the primary technical projection is a rotation towards the top of the established daily range, marked by recent highs near 2.11. A secondary, more optimistic projection lies at the weekly R2 pivot of 2.18, which aligns with previous structural highs. Confirmation of the rebound's strength would be signaled by a sustained daily close above the D1 EMA 50 at 1.94. Conversely, the framework would show signs of weakening if the price fails to push past the immediate 1.86-1.89 resistance and falls back below the D1 pivot at 1.82, indicating that the initial bounce from the lows lacks sufficient momentum.


Breakout: Structural Catalyst Assessment
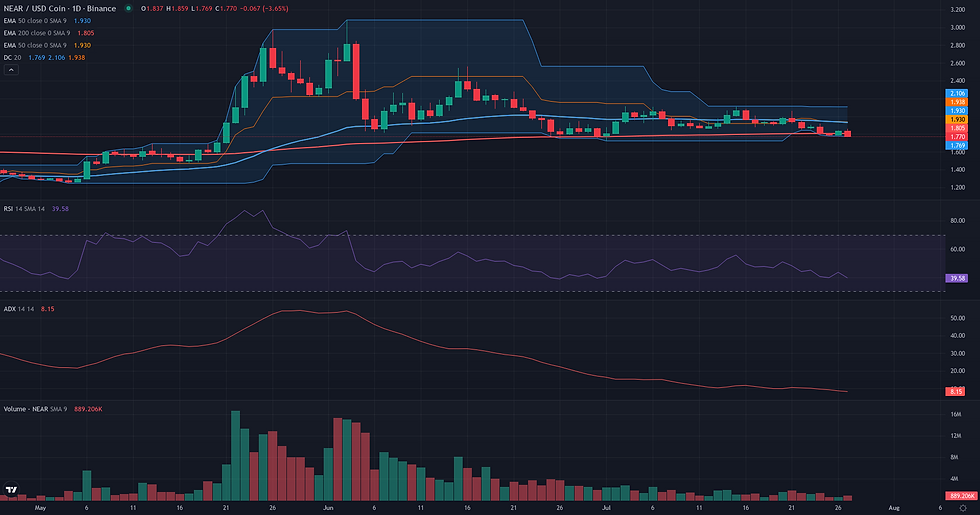
The Breakout framework is currently not plausible for NEAR/USDC. The market structure lacks the essential characteristics of a pre-breakout phase, namely compression below resistance and building directional energy. The primary resistance level is clearly defined at 2.11 USDC, the 20-day Donchian high, which has been tested multiple times in early July. However, instead of consolidating beneath this ceiling, the price has since fallen to the lower end of its range, closing recently at 1.84 USDC. This price action signifies a rejection of higher prices, not an accumulation for a potential break. This structural weakness is compounded by a complete absence of momentum. The ADX D1 indicator registers an extremely low value of 8.56, signaling a deeply non-trending and listless market. A breakout, by definition, is a release of directional energy, and none is being built here. Furthermore, the RSI D1 at 43.56 points to a slight bearish bias, and the Volume Oscillator D1 at -35.51 confirms declining participation. For this framework to become relevant, the market would need to demonstrate a fundamental shift: price would have to reclaim levels closer to the 2.11 resistance, and momentum indicators like the ADX would need to rise significantly, indicating the return of a directional trend.
Continuation: Directional Flow Assessment
The Continuation framework is currently not plausible for NEAR/USDC. The analysis reveals a market structure that fundamentally lacks the primary characteristic required for this strategy: a stable and established directional flow. The most significant indicator of this condition is the daily ADX, which stands at an exceptionally low 8.56, signaling a non-trending or ranging market environment. This absence of trend is further corroborated by a weak daily RSI of 43.56 and the price's position below key dynamic resistance levels, including the EMA 50 D1 at 1.94 and the current weekly pivot at 1.89. While the price is finding some potential footing near the long-term EMA 200 D1 (1.82), this represents a potential support test rather than a continuation of a prior impulse. The broader weekly context confirms this reading, showing a multi-week corrective phase following a peak in early June. For a Continuation scenario to become relevant, the market would first need to break out of this corrective structure, establish a clear series of higher highs and lows, and demonstrate a significant increase in directional momentum, reflected by the ADX rising well above 20.

Comparative Framework Verdict
Comparing the three technical frameworks, the Range/Rebound scenario emerges as the only plausible interpretation of the current market structure for NEAR/USDC. Its coherence is built on the most dominant market feature: a complete absence of directional trend, confirmed by an extremely low daily ADX of 8.56. This framework correctly identifies the price action as a test of the lower boundary of a multi-week range, with a validation zone between $1.78 and $1.82, an area reinforced by the 200-day EMA and recent lows. The oversold condition on the daily Stochastic further supports the potential for a bounce from this support. Conversely, both the Breakout and Continuation frameworks are assessed as not plausible. Their invalidity stems from the same core reason: the lack of any discernible trend or building momentum. A breakout requires directional energy to breach resistance at $2.11, while a continuation requires an existing trend to extend. With the ADX so low and price testing support rather than resistance, neither condition is met. The market is clearly in a corrective, non-directional phase, rendering these trend-following strategies inapplicable. Looking ahead, the key element to monitor is whether the support within the $1.78-$1.82 zone holds. A successful defense could see price rotate back towards the mid-range resistance around the 50-day EMA at $1.94. A failure of this support would invalidate the range thesis and open the door to a new downward leg.
For broader market context, readers can also review the latest related fundamental analysis for this pair.
For live market monitoring and the full interactive chart, readers can access the dedicated NEAR Market Hub.
Disclaimer
CopyTradia provides technical analysis for informational and educational purposes only. This content does not constitute financial advice, investment recommendations, or trading signals. Cryptocurrency markets are highly volatile. Past performance is not indicative of future results. Always conduct your own research (DYOR) and consult a qualified financial advisor before making any investment decisions.


