NEAR Range Rebound Analysis: Consolidation Deepens
- CopyTradia Intelligence

- Jul 9
- 5 min read
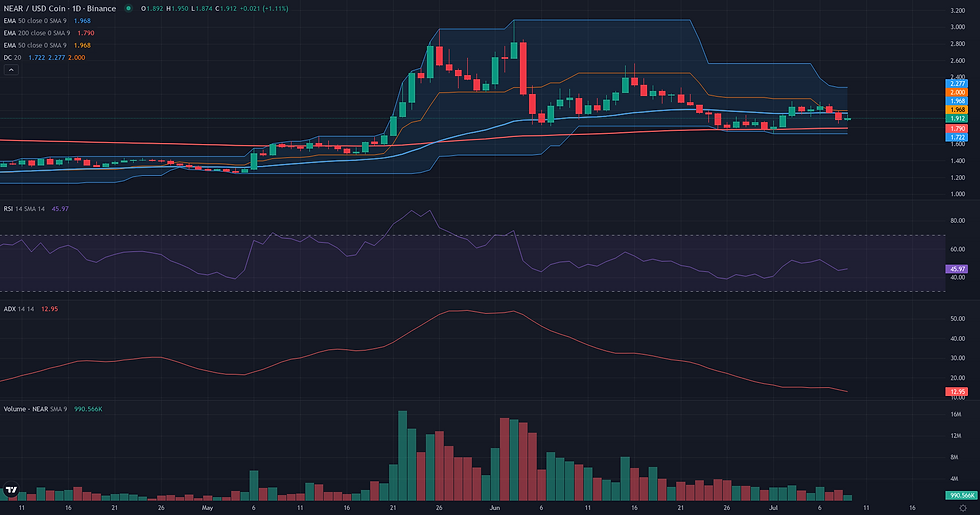
This NEAR range rebound analysis examines the current NEAR/USDC structure in the context of support defense and weakening alternative frameworks. NEAR/USDC is currently in a phase of distinct consolidation, trading at approximately 1.89 after finding support above key long-term moving averages. The market's character is one of indecision and equilibrium, clearly reflected in the technical indicators. The D1 ADX is exceptionally low at 13.94, signaling a strong absence of any directional trend and favoring range-bound price action. Momentum is neutral to slightly weak, with the D1 RSI hovering just below the 50 mark at 44.81. This technical picture of stabilization aligns with recent fundamental observations, which noted a decrease in realized volatility and balanced speculative positioning with funding rates near baseline. Price is currently caught between the D1 EMA 200 support at 1.80 and the D1 EMA 50 resistance near 1.97, creating a well-defined zone of contention that will likely dictate the next significant directional move.

NEAR Range Rebound Analysis: Support and Friction Zones
Following the identification of a plausible Range/Rebound framework, the resolution analysis focuses on the key levels that will either confirm or invalidate this scenario. The foundational support, or validation zone, is established between 1.72 and 1.80 USDC, an area reinforced by multiple structural indicators. The framework would lose its coherence if the market produces a daily close below 1.72, as this would break the recent swing low and signal a failure of the stabilization attempt, likely leading to further downside exploration. For the rebound to gain traction, it faces a series of technical obstacles. The first significant friction zone lies at 1.95-1.97, a confluence of the daily EMA 50 (1.97) and the weekly pivot (1.95). This area represents the current equilibrium, and a decisive break above it is necessary to confirm bullish intent. Should buyers succeed, the next point of resistance is the recent swing high at 2.11, which defines the upper boundary of the current consolidation range. If the framework confirms with a breakout above these friction levels, the initial projection zone is located between 2.11 and the W1 R1 pivot at 2.18. A sustained move into this area would solidify the rebound narrative. A more optimistic secondary projection lies at the W1 R2 pivot of 2.34. Conversely, a clear rejection from the 1.95-1.97 resistance would be a weakening signal, suggesting that sellers retain control and increasing the probability of another test of the 1.72-1.80 support floor.


Breakout: Structural Catalyst Assessment
The Breakout framework is currently not plausible for NEAR/USDC. The market structure does not exhibit the necessary characteristics of pre-breakout compression against a well-defined resistance. Instead, the daily chart shows a corrective phase following a significant rejection from the 2.56 USDT level in mid-June. The price has since trended downwards and is currently trading in the lower part of its recent range, significantly below potential breakout levels like the Donchian 20-day high at 2.28 USDT. Several key indicators reinforce this assessment. Momentum, as measured by the D1 RSI, is weak at 44.81, below the neutral 50 mark. More critically, the D1 ADX reading of 13.94 indicates a complete lack of a directional trend, which is contrary to the energy accumulation typically seen before a structural break. This is further corroborated by a negative Volume Oscillator (-34.70), signaling that recent price action is not supported by buyer conviction. For this framework to become relevant, the price would first need to reclaim key levels like the D1 EMA50 at 1.97 USDT and then build a sustained consolidation pattern directly beneath a clearly defined resistance, accompanied by a resurgence in both momentum and volume.
Continuation: Directional Flow Assessment
The Continuation framework is assessed as not plausible for NEAR/USDC at this time. The primary reason for this conclusion is the market's pronounced lack of directional trend, which is a fundamental prerequisite for a continuation scenario. The ADX indicator on the daily chart is at a very low 13.94, unequivocally signaling a period of consolidation or range-bound activity rather than a 'Stable Directional Flow'. This structural indecision is further reflected in the price action, which is currently compressed between the short-term resistance of the D1 EMA50 at 1.97 and the longer-term support of the D1 EMA200 at 1.80. With daily momentum leaning bearish (RSI D1 at 44.81) and price action also below the weekly EMA50 (2.05), the context does not support the hypothesis of an ongoing, stable trend. For this framework to become relevant, the market would first need to establish clear directional intent, likely signaled by a breakout from its current range and a significant increase in the ADX.

Comparative Framework Verdict
In the current market structure for NEAR/USDC, the three strategic frameworks present a clear hierarchy of plausibility. The Range/Rebound scenario emerges as the most coherent and dominant framework. Its plausibility is firmly supported by the market's lack of directional momentum, evidenced by a very low D1 ADX reading. Price action is respecting a significant support floor identified between 1.72 and 1.80, a zone reinforced by the D1 EMA 200 and recent swing lows. This suggests that selling pressure has been absorbed, leading to a period of stabilization rather than a continuation of the prior downtrend. Conversely, both the Breakout and Continuation frameworks are assessed as not plausible. The core conditions required for these scenarios—strong directional energy for a breakout and an established trend for a continuation—are fundamentally absent. The low ADX and weak D1 RSI directly contradict the premises of both frameworks, rendering them technically invalid in the current context. The market is not building energy for a break nor is it following an existing directional flow. Therefore, the most relevant technical narrative is one of range-bound activity. The key focus for the upcoming period will be on the market's reaction to the boundaries of this consolidation. A defense of the 1.72-1.80 support zone would reinforce the range thesis, while a successful push above the initial resistance cluster around 1.95-1.97 would be the first sign of a potential shift in control towards buyers.
For broader market context, readers can also review the latest related fundamental analysis for this pair.
For live market monitoring and the full interactive chart, readers can access the dedicated NEAR Market Hub.
Disclaimer
CopyTradia provides technical analysis for informational and educational purposes only. This content does not constitute financial advice, investment recommendations, or trading signals. Cryptocurrency markets are highly volatile. Past performance is not indicative of future results. Always conduct your own research (DYOR) and consult a qualified financial advisor before making any investment decisions.


