NEAR Protocol Momentum Builds Amidst Relative Underperformance

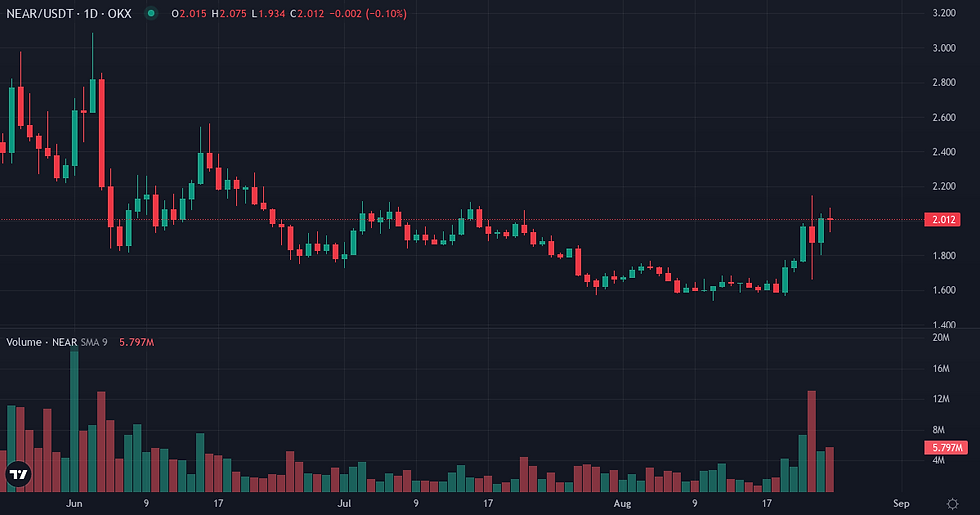
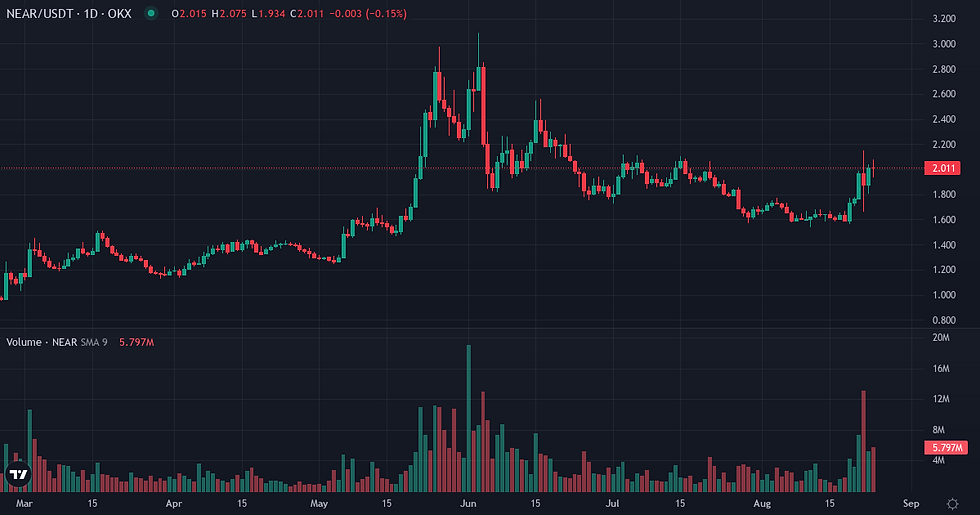
NEAR Protocol experienced a week of notable spot price appreciation and increased volume, indicating renewed interest. However, this internal strength was observed within a broader market context where the asset continued to underperform against Bitcoin. The overall environment for NEAR Protocol momentum was characterized by lower realized volatility compared to its historical average, suggesting a more controlled upward movement.
Price Action and Volatility Overview
NEAR Protocol recorded a significant 20.30% gain over the past seven days, building on an 11.00% increase over the last 30 days, with its spot price settling at $2.00. This upward price action occurred in an environment of subdued volatility, as the 7-day realized volatility of 68.50% and 30-day realized volatility of 63.31% remained notably below the 90-day baseline of 112.80%. Despite its own positive performance, NEAR demonstrated relative weakness against Bitcoin, declining by 2.1882% over the week and 13.3471% over the past month. Volume momentum, at 1.323, indicates that recent 24-hour trading activity has surpassed its 7-day average, supporting the recent price move. Structurally, NEAR remains 90.22% below its all-time high.
Metric | Value |
NEAR Price | $2.00 (+2.68% 24h / +20.30% 7d / +11.00% 30d) |
Volume 24h | $446.4M |
Native Quote Vol. 24h | $12.4M |
Market Cap | $2.60B |
Market Cap Rank | 38 |
Circulating Supply | 1.30B NEAR |
ATH Distance | 90.22% below ATH |
Metric | Value |
NEAR/BTC Ratio | 0.00002500 |
Relative Perf. 7d vs BTC | -2.19% |
Relative Perf. 30d vs BTC | -13.35% |
Derivatives Market and Speculative Positioning
Speculative positioning for NEAR Protocol showed an expansion in derivatives exposure, with Open Interest increasing by 8.12% over the past seven days to $0.079B, although it remains slightly below its 90-day baseline of $0.084B. The funding rate, currently at 0.010000% and a 7-day cumulative of 0.056119%, indicates a prevalent long bias among leveraged traders. This long positioning is further supported by a 30-day funding Z-score of 0.5608, suggesting funding rates are above their recent average. However, the liquidation data reveals that long liquidations totaled $9.0M over the week, accounting for 76.5% of all liquidations, compared to $2.8M in short liquidations. While the 30-day average liquidation profile remains balanced, the recent dominance of long liquidations suggests some pressure or profit-taking against the prevailing long sentiment.
Metric | Value |
Funding Rate (current) | +0.0100% |
Funding Cumul. 7d | +0.0561% |
Open Interest | $0.08B (+8.12% 7d) |
Liq. 24h Longs | $0M |
Liq. 24h Shorts | $0M |
Liq. 7d Longs | $9M |
Liq. 7d Shorts | $3M |
Metric | Value |
Realized Vol 7d | +68.50% (90d avg: +112.80%) |
Realized Vol 30d | +63.31% |
Corr. BTC 30d | 0.5720 (90d avg: 0.5897) |
Beta vs BTC | 0.9573 |
Volume Momentum | 1.3230x |
Funding Z-Score 30d | 0.56σ |
Turnover Ratio | 0.1715 |
Liq. Intensity | 0.00454 |
Key Monitoring Conditions for NEAR
Monitoring conditions for the upcoming week include observing whether NEAR Protocol can sustain its internal price momentum while narrowing its performance gap against Bitcoin; a continued decline in the NEAR/BTC ratio would signal persistent capital rotation away from the asset. The evolution of Open Interest and funding rates will also be critical; a sustained increase in Open Interest alongside elevated positive funding would suggest growing leveraged conviction, whereas a contraction or shift in funding could indicate a change in speculative sentiment. Externally, the macro schedule presents potential market catalysts with the release of the Core PCE Price Index and Prelim GDP data on August 26, followed by Unemployment Claims on August 27, which could influence broader market liquidity and risk appetite, potentially impacting NEAR's price dynamics.
Indicator | Value | Variation |
Broad Dollar Index | 118.90 | flat (7d) |
US 10Y Yield | 4.69% | -0.03pp (7d) |
Fed Balance Sheet | $6746B | -$14,256M (7d) |
M2 Money Supply | $23,155B | +$99.6B (1m) |
Fear & Greed | 73 (Greed) | +32 pts (7d) |
Fear & Greed Index: Alternative.me
NEAR Protocol Weekly Takeaway
NEAR Protocol concluded the week demonstrating internal strength through significant spot gains and increased trading volume, yet this was set against a backdrop of continued underperformance relative to Bitcoin. The asset's price appreciation occurred in a lower volatility environment than its historical norm, suggesting a more measured ascent. Leveraged positioning has expanded with a clear long bias, but recent liquidation patterns indicate that this long exposure has faced some pressure. The overall market state for NEAR suggests a pair attracting renewed attention, but one that has not yet established autonomous outperformance against the broader crypto benchmark.
Disclaimer
This article provides a fundamental analysis of NEAR Protocol based on available market data and should not be construed as investment advice or a recommendation to buy or sell any asset.


