NEAR Continuation Technical Analysis: Price Consolidates

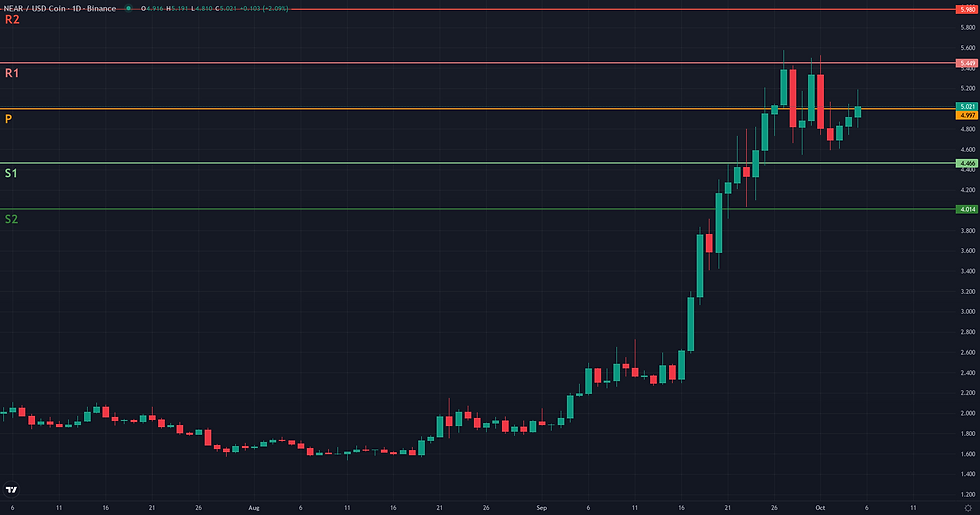
This NEAR continuation technical analysis examines the current NEAR/USDC structure in the context of support defense and weakening alternative frameworks. NEAR/USDC is currently navigating a period of consolidation after a powerful uptrend, with the daily close at 4.92. The market structure is defined by extremely strong directional momentum, confirmed by a D1 ADX reading of 61.52, while the D1 RSI at 65.12 indicates robust but not yet extreme bullish sentiment. Price action remains well above key long-term moving averages, such as the D1 EMA 200 at 2.27 and the W1 EMA 200 at 4.31, reinforcing the underlying bullish bias. This technical pause follows a significant rally and aligns with the latest fundamental context, which highlights expanding leverage in derivatives markets despite a minor weekly price pullback, suggesting sustained market interest. The current price behavior, caught between the recent high of 5.53 and the weekly low of 4.54, sets the stage for several potential technical scenarios.
Range & Rebound: Market Structure Assessment
The Range/Rebound framework is currently not plausible for NEAR/USDC. The market structure is defined by a powerful, directional uptrend, which is fundamentally at odds with the framework's premise of identifying stabilization within a range or a rebound from a support level after a decline. Technical indicators confirm the strength of this trend: the D1 ADX registers a very high value of 61.52, signaling a strongly trending environment, while the D1 RSI at 65.12 reflects robust bullish momentum. The recent pullback from the 5.58 high to the 4.54 low is, in this context, a minor correction rather than the basis for a controlled reversal. For the Range/Rebound framework to become relevant, a significant structural shift would be required, such as the development of a multi-week consolidation pattern or a clear break of the current bullish momentum confirmed by a fall below key weekly supports.

Breakout: Structural Catalyst Assessment
The current market structure presents a compelling but conflicted case for a breakout scenario. A powerful daily uptrend, evidenced by an exceptionally high ADX of 61.52, has paused beneath a clearly defined resistance ceiling at 5.58. This level marks the peak of the recent rally and the upper Donchian Channel band. The technical preparation for a potential move is visible in the volume profile; a Volume Oscillator of -25.17 indicates that volume has significantly decreased during this consolidation, a classic sign of energy coiling before a potential expansion. However, the structure is not a textbook pre-breakout pattern. Rather than compressing tightly under resistance, the price was rejected from the 5.58 level and has since established a wider trading range. This ambiguity is compounded by the weekly context, where an elevated RSI of 74.92 suggests the broader trend is mature. This tension between the powerful underlying trend and the signs of potential exhaustion at a key structural barrier makes the breakout framework technically borderline.

NEAR Continuation Technical Analysis: Directional Flow Assessment
The market structure for NEAR/USDC presents a technically plausible case for a bullish continuation. The primary driver for this reading is a powerful, established uptrend visible on both daily and weekly charts. This directional flow is structurally confirmed by the price holding significantly above key moving averages, including the D1 EMA50 (3.37) and the W1 EMA200 (4.31). The trend's health is further quantified by a very strong D1 ADX reading of 61.52, indicating a robust directional market. The recent price action has been a consolidation following a peak at 5.58. This pullback found support near 4.54, successfully defending a zone just above the Weekly S1 pivot (4.47). A shallow correction that respects key support levels, particularly on lower relative volume as suggested by the D1 Volume Oscillator (-25.17), is often characteristic of a healthy pause within an ongoing trend rather than a reversal. While the overall structure is constructive, the weekly RSI is elevated at 74.92, suggesting the broader move is mature. The current price action is also navigating the Weekly Pivot at 5.00, a natural point of equilibrium causing some local indecision. Overall, the balance of evidence, led by the powerful trend structure and the quality of the recent pullback, supports the plausibility of the continuation framework.

Comparative Framework Verdict
In this week's NEAR weekly technical analysis, three strategic frameworks were assessed, yielding a clear hierarchy of plausibility. The Continuation framework emerges as the most coherent scenario. Its plausibility is anchored in the dominant daily and weekly uptrend, evidenced by a powerful D1 ADX of 61.52 and price holding above crucial long-term moving averages. The recent pullback is viewed as a constructive pause, having found support above key weekly pivot levels, which is characteristic of a healthy trend. In a secondary position, the Breakout framework is rated borderline. While it benefits from the same strong underlying trend and a clear resistance level at 5.58, its plausibility is tempered. The consolidation is wider than ideal for an imminent breakout, and an elevated weekly RSI of 74.92 suggests the long-term trend is mature and could be susceptible to exhaustion. This creates a conflict between the trend's strength and signs of potential fatigue. Finally, the Range/Rebound framework is considered not plausible. The market's powerful directional character is fundamentally inconsistent with the conditions required for a range-bound or reversal scenario. Monitoring the interaction with the Weekly Pivot around 5.00 and the 5.58 resistance will be key to confirming whether the current pause resolves as a continuation.
For broader market context, readers can also review the latest related fundamental analysis for this pair.
For live market monitoring and the full interactive chart, readers can access the dedicated NEAR Market Hub.
Disclaimer
CopyTradia provides technical analysis for informational and educational purposes only. This content does not constitute financial advice, investment recommendations, or trading signals. Cryptocurrency markets are highly volatile. Past performance is not indicative of future results. Always conduct your own research (DYOR) and consult a qualified financial advisor before making any investment decisions.


