LINK/USDC Range Rebound Analysis: Consolidation Builds

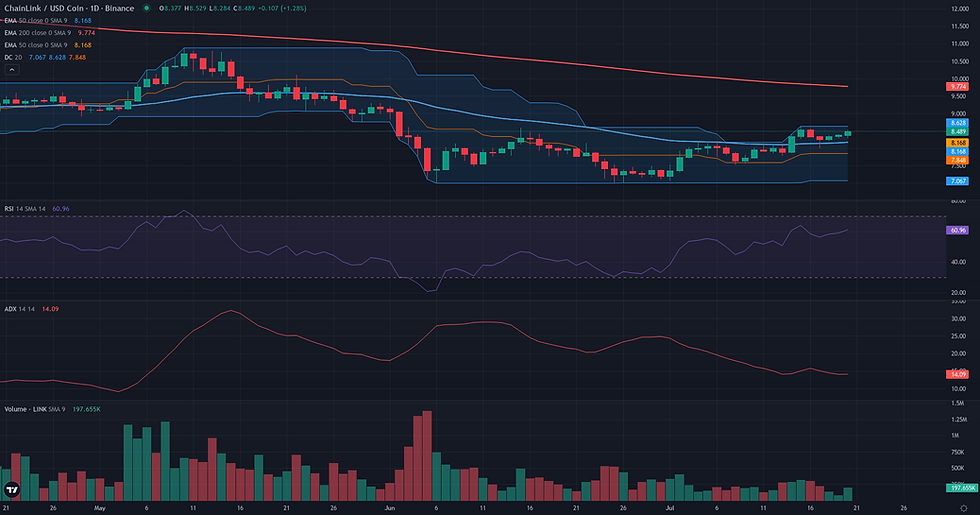
This LINK/USDC range rebound analysis examines the current LINK/USDC structure in the context of support defense and weakening alternative frameworks. LINK/USDC is currently consolidating in the upper portion of its recent range, closing the daily session at 8.38 USDC. The market structure presents a notable conflict between short-term momentum and the broader trend environment. The daily RSI at 58.80 indicates a bullish bias, yet the D1 ADX reading is exceptionally low at 14.04, signaling a distinct lack of directional trend and a state of compression. Price action remains contained within the weekly boundaries of 8.00 and 8.63, holding above the D1 EMA50 but still significantly below major weekly moving averages. This technical state of consolidation aligns with recent fundamental observations of sustained positive performance amidst a contraction in volatility, suggesting a market gathering energy rather than following a clear directional bias. The following analysis explores three technical frameworks—Range/Rebound, Breakout, and Continuation—to interpret this complex structure.

LINK/USDC Range Rebound Analysis: Support and Friction Zones
The resolution for the LINK/USDC range rebound framework is anchored to the defense of the 7.00 - 7.31 USDC support zone. This area represents the structural floor of the established daily range, and its integrity is paramount for the framework's coherence. The invalidation condition is therefore straightforward: a daily close below the 7.00 low would break the range structure and suggest a resumption of the prior bearish trend. For the rebound to gain traction, it must navigate several layers of resistance. The most significant friction zone is the range ceiling, a cluster defined by the recent D1 high at 8.63 and the weekly R1 pivot at 8.67. This area has already shown signs of resistance, evidenced by a bearish 'hangingman' pattern on the daily chart. Internally, the D1 EMA 50 at 8.15 serves as a crucial pivot; holding above it maintains short-term bullish pressure, while losing it would be a sign of weakness. A confirmed rebound would manifest as a strong price rejection from the 7.00-7.31 validation zone, followed by a sustained move above the D1 EMA 50. The primary technical projection for such a move is the top of the range at 8.63. Should the market show enough strength to break out from this consolidation, the next logical reference point would be the weekly R2 pivot at 8.96. Conversely, the framework would weaken if price fails to hold the 8.15 level, signaling a potential loss of momentum and a more vulnerable retest of the range lows.


Breakout: Structural Catalyst Assessment
The technical structure for LINK/USDC presents a classic but conflicted breakout scenario, leading to a borderline assessment. On the daily chart, the setup is compelling. Price has established a clear horizontal resistance at the 8.63 level, which aligns with the 20-day Donchian channel upper band and the prior week's high. Following a test of this level, the price has entered a tight consolidation phase just below it, a pattern often indicative of energy accumulation before a potential directional move. This reading is reinforced by converging secondary indicators: the D1 Volume Oscillator at -25.69 shows a significant dry-up in volume, while a low ADX of 14.04 points to a state of compression. Furthermore, the D1 RSI at 58.80 maintains a bullish bias without being overextended. However, this constructive daily picture faces a formidable challenge from the weekly timeframe. The broader context remains bearish, with the price trading substantially below key long-term averages like the EMA 50 W1 at 11.41. The weekly RSI of 41.98 confirms this underlying weakness. This creates a significant structural tension: a bullish D1 breakout attempt would be a counter-trend move against a bearish weekly backdrop. It is this direct conflict between the tactical setup and the strategic context that makes the framework borderline. A break above 8.63 is technically possible, but its sustainability is questionable given the overhead resistance.
Continuation: Directional Flow Assessment
The technical structure for LINK/USDC presents a borderline case for a bullish continuation. On one hand, the daily chart displays a constructive short-term uptrend, initiated from a low of 7.00 and culminating in a recent high of 8.63. The subsequent pullback has found stability above key dynamic supports, namely the D1 EMA50 at 8.15 and the 4H EMA200 at 8.03, with the D1 RSI holding a positive reading of 58.80. This price action suggests a potential consolidation before another upward leg. However, this bullish interpretation is severely challenged by a critical lack of directional energy. The D1 ADX reading of 14.04 is exceptionally low, indicating a ranging market rather than the strong, stable trend required by the continuation framework. This weakness is compounded by a bearish weekly context, where the price remains far below its major moving averages. The current daily rally is therefore best viewed as a counter-trend move within a larger bearish structure, making its potential for sustained continuation uncertain.

Comparative Framework Verdict
Comparing the three technical frameworks, the Range/Rebound scenario emerges as the most plausible interpretation of the current market structure for LINK/USDC. Its core thesis is strongly supported by the prevailing data, particularly the very low D1 ADX of 14.04, which confirms a non-trending, consolidative environment. The framework clearly defines the operational boundaries between the structural support area around 7.00-7.31 and the well-established resistance near 8.63, providing a coherent map for the ongoing price action. The Breakout and Continuation frameworks are both assessed as borderline, primarily due to a shared structural weakness: they both propose a bullish move that would act as a counter-trend rally against a bearish weekly backdrop. The Continuation framework is arguably the weaker of the two, as its requirement for a stable directional trend is directly contradicted by the low ADX reading. The Breakout scenario, while also facing overhead resistance from the weekly chart, more accurately describes the current price compression below the 8.63 resistance as a potential precursor to a directional move. Ultimately, the market's direction hinges on the resolution of this compression. A failure to generate sufficient momentum to overcome the 8.63 ceiling would reinforce the dominant Range/Rebound framework, favoring a rotation back towards the lower part of the range. Conversely, a decisive and high-volume breach of this resistance would lend credibility to the borderline Breakout scenario.
For broader market context, readers can also review the latest related fundamental analysis for this pair.
For live market monitoring and the full interactive chart, readers can access the dedicated LINK Market Hub.
Disclaimer
CopyTradia provides technical analysis for informational and educational purposes only. This content does not constitute financial advice, investment recommendations, or trading signals. Cryptocurrency markets are highly volatile. Past performance is not indicative of future results. Always conduct your own research (DYOR) and consult a qualified financial advisor before making any investment decisions.


