ETH Range Rebound Analysis: Support Zone Under Pressure

This ETH range rebound analysis examines the current ETH/USDC structure in the context of support defense and weakening alternative frameworks. ETH/USDC is navigating a critical technical juncture after a period of sustained decline. The price has fallen below its key weekly moving averages (50-W1 EMA and 200-W1 EMA), establishing a bearish medium-term structure. Currently, the asset is testing a significant support zone defined by the 200-day EMA around 2297 and the recent weekly low of 2280. This test of support occurs within a broader context of sustained downward pressure and increased volatility, as highlighted in the latest fundamental analysis for the pair. Momentum indicators reflect this tension: the daily ADX at 28.41 confirms a trending environment, but the daily RSI at 34.10 is approaching oversold territory, suggesting the recent bearish move may be losing strength. The market's reaction to this support area will likely dictate the directional bias in the near term, setting the stage for either a technical rebound or a continuation of the prevailing downtrend.
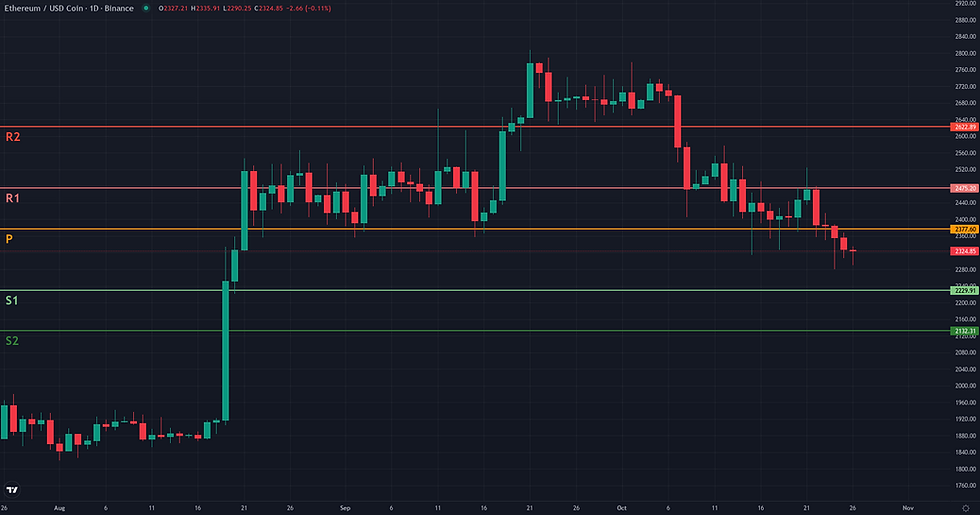
ETH Range Rebound Analysis: Support and Friction Zones
The Range/Rebound framework for ETH/USDC is being tested within its validation zone of 2280.00 - 2297.65, a critical support area defined by the D1 EMA 200 and recent lows. The resolution from this point will determine whether a technical bounce can materialize or if the prevailing downtrend will resume. Invalidation of this rebound scenario would occur with a structural breakdown, specifically a daily close below 2280.00. Such a move would negate the support structure and suggest a continuation of the bearish trend, potentially targeting the D1 S2 pivot at 2273.42. The path for a potential rebound is layered with several friction zones. Immediately, the price faces the daily pivot at 2334.66, followed by the weekly pivot at 2377.60. However, the most significant barrier is a dense resistance cluster between approximately 2460 and 2481. This zone contains the D1 EMA 50 (2462.97), the W1 R1 pivot (2475.20), and the formidable W1 EMA 200 (2480.69). Should the rebound gather enough momentum to overcome these obstacles, the first technical projection zone is the area of the recent daily high around 2525. A more extended and confirmed rebound could look towards the W1 R2 pivot at 2622.89. Confirmation of the rebound's strength would involve a sustained move above the weekly pivot, while failure to do so would be a weakening signal.


Breakout: Structural Catalyst Assessment
The Breakout framework is currently not plausible for ETH/USDC. The market structure does not exhibit the necessary pre-conditions of compression or consolidation beneath a resistance level. Instead, the price is in a distinct daily downtrend, having moved significantly away from the resistance zone established around 2777-2807 in late September and early October. The current price action is characterized by lower lows and lower highs, with the last close at 2327.51, far below any potential breakout level. This bearish dynamic is confirmed by momentum indicators; the D1 RSI is weak at 34.10, and the D1 ADX at 28.41 indicates a strengthening bearish trend. Critically, the weekly context reinforces this negative outlook, as the price has lost the support of the W1 EMA 200 at 2480.69, a key long-term average that now acts as major resistance. For a breakout scenario to become relevant, the market would first need to halt its descent, establish a new consolidation base, and reclaim key structural levels, including the weekly 200-period moving average.

Continuation: Directional Flow Assessment
The current market structure presents a borderline case for a bearish continuation. On one hand, the directional bias is clearly negative. The daily chart displays a consistent pattern of lower highs and lower lows throughout October, a classic sign of a downtrend. This bearish sentiment is reinforced on the weekly timeframe, where price has decisively broken below both the 50-week and 200-week EMAs, formerly key support zones now acting as potential overhead resistance. However, this bearish narrative is met with significant friction that prevents a clean 'plausible' reading. The daily RSI, at 34.10, is nearing levels that often precede short-term bounces, suggesting the downward momentum may be overextended. More critically, the price is currently consolidating just above the 200-day EMA at 2297.65, a major long-term support level. While the recent low at 2280.00 pierced this level, the lack of a sustained break below it on a closing basis creates ambiguity. This hesitation, combined with a weak weekly ADX of 20.03, suggests the downtrend lacks strong, established momentum, making the structure vulnerable to a consolidation phase or a more significant technical rebound.

Comparative Framework Verdict
Among the three technical frameworks analyzed, the Range/Rebound scenario emerges as the most plausible. This view is supported by the price action testing a strong confluence of daily support between 2280.00 and 2297.65, which includes the 200-day EMA and the recent swing low. Signs of momentum exhaustion, such as a daily RSI near 34, reinforce the potential for a technical bounce from this critical zone. In contrast, the bearish Continuation framework is rated as borderline. While the established downtrend and the break below key weekly moving averages provide strong arguments for further downside, there are significant weakening factors. The price is currently holding above the 200-day EMA, and momentum indicators suggest the downtrend is overextended in the short term, making a continued, uninterrupted decline less certain. The Breakout framework is considered not plausible. The market is in a clear downtrend, moving away from any significant resistance levels. The necessary conditions for a breakout, such as price compression below a well-defined ceiling, are absent. The key focus for the upcoming sessions will be the market's ability to defend the 2280.00 support level. A successful hold could validate the rebound thesis, whereas a decisive break below would give credence to the continuation scenario.
For broader market context, readers can also review the latest related fundamental analysis for this pair.
For live market monitoring and the full interactive chart, readers can access the dedicated ETH Market Hub.
Disclaimer
CopyTradia provides technical analysis for informational and educational purposes only. This content does not constitute financial advice, investment recommendations, or trading signals. Cryptocurrency markets are highly volatile. Past performance is not indicative of future results. Always conduct your own research (DYOR) and consult a qualified financial advisor before making any investment decisions.


