ETH Range Rebound Analysis: Low Volatility Dominates

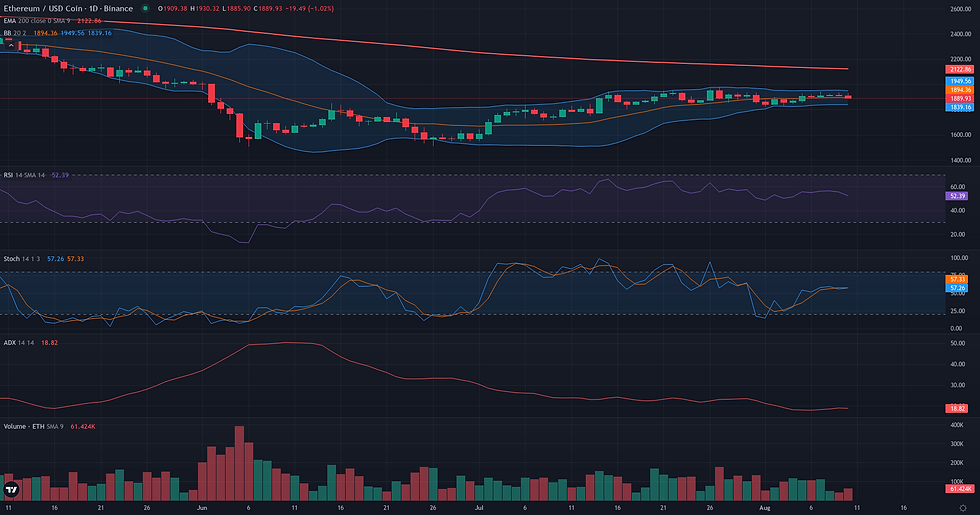
This ETH range rebound analysis examines the current ETH/USDC structure in the context of support defense and weakening alternative frameworks. The ETH/USDC market is currently defined by a distinct consolidation phase, with the daily close at $1909.42 reflecting a state of technical equilibrium. This sideways price action is strongly confirmed by key momentum indicators: the daily ADX registers a very low 18.99, signaling a clear lack of directional trend, while the RSI sits at a neutral 55.59. Structurally, the price is navigating a critical zone, holding above the 50-day EMA support at $1860.92 but remaining significantly below the long-term 200-day EMA at $2167.63. This technical picture of consolidation and low directional momentum aligns with the latest fundamental analysis, which highlights a market characterized by sustained low volatility and balanced leveraged positioning, rather than a strong directional bias. The current structure sets the stage for three potential scenarios: a continuation of range-bound trading, a potential breakout, or a resumption of a directional trend.

ETH Range Rebound Analysis: Support and Friction Zones
Following the test of the 1825-1845 validation zone, the Range/Rebound framework for ETH/USDC is now in its resolution phase. The immediate price action shows a constructive bounce, having reclaimed the D1 50 EMA (1860.92), a positive sign for the rebound's viability. The market structure remains defined by the daily range, with the primary technical projection for this rebound being the upper boundary, a resistance zone between 1955 and 1980. This area is a significant technical confluence, reinforced by the W1 R1 pivot at 1958.53 and recent swing highs. Before reaching that primary projection, the rebound must navigate intermediate friction zones. The first notable obstacle lies between 1928 and 1948, an area mapped by the D1 R1 and R2 pivots. A successful push through this tactical resistance would confirm momentum. Conversely, the framework's coherence would be invalidated if sellers regain control and achieve a daily close below the 1820-1825 support floor, as this would signify a structural breakdown of the range itself. A weakening of the current upward momentum, without full invalidation, would be signaled by a failure to hold above the D1 50 EMA. While the daily chart supports the rebound scenario, the overarching weekly trend remains bearish, suggesting that any upward resolution may be capped by the top of the identified range.

Breakout: Structural Catalyst Assessment
The Breakout framework presents a borderline case for ETH/USDC. The market structure on the daily chart is constructive, characterized by a multi-week consolidation phase beneath a clearly identifiable resistance zone. This ceiling is defined by the 20-day Donchian high at 1980.30 and reinforced by the weekly R1 pivot at 1958.53. Such a prolonged period of sideways price action, confirmed by a low D1 ADX of 18.99, is a classic precursor to a potential structural break. Daily momentum indicators offer support, with the RSI at 55.59 and price holding above its 50-day EMA. However, this reading is tempered by significant friction from the weekly timeframe. The weekly RSI remains below 50 (42.91) and price is substantially under its key moving averages, indicating that any daily breakout would be a counter-move against a larger bearish context. The lack of volume conviction, evidenced by a negative Volume Oscillator, further weakens the case for an imminent and powerful resolution. The current structure is therefore caught in a technical tension: a promising daily consolidation pattern faces strong headwinds from the higher timeframe, making the breakout scenario technically readable but not yet fully plausible.

Continuation: Directional Flow Assessment
The technical structure for ETH/USDC presents a challenging case for a bullish continuation framework. The market is caught in a clear state of tension between a tentatively positive price structure and a significant lack of directional momentum. On one hand, the price has established a series of higher lows since its June bottom and is currently holding above a critical support confluence formed by the daily EMA 50 (1860.92) and the weekly pivot point (1892.57). This positioning suggests a potential base for further upside. However, this structural argument is severely undermined by weak underlying dynamics. The daily ADX, a key measure of trend strength, registers a very low 18.99, signaling a range-bound or non-trending environment rather than the "Stable Directional Flow" this framework seeks. This is corroborated by a negative Volume Oscillator (-23.61), indicating that conviction is fading. Furthermore, the weekly context acts as a bearish overhang; price remains far below major weekly moving averages, and the weekly RSI (42.91) is still in bearish territory. This suggests the current daily uptrend is, for now, a counter-trend move within a larger bearish structure. The immediate H1 action also shows signs of weakness, adding another layer of caution. Consequently, the continuation framework is deemed borderline, pending a clear resolution with renewed momentum.

Comparative Framework Verdict
Comparing the three technical frameworks, the Range/Rebound scenario emerges as the most plausible. Its coherence is rooted in the market's clear, multi-week consolidation and is strongly supported by a daily ADX of 18.99, which confirms a non-trending environment. This framework is currently active, having seen price test and hold its support validation zone around 1825-1845, with the upper boundary near 1955-1980 acting as the primary projection for the rebound. In contrast, both the Breakout and Continuation frameworks are rated as borderline. Their potential is constrained by the same factor that strengthens the range scenario: the profound lack of directional momentum. The Breakout framework presents a logical 'what if' scenario, describing the conditions for a structural shift out of the current equilibrium, but it lacks the necessary trend strength to be considered probable. The Continuation framework is the weakest of the three, as its core premise of a 'Stable Directional Flow' is directly contradicted by the low ADX reading. While the price holds above some key moving averages, the absence of momentum renders a sustained trend continuation unlikely for now. Moving forward, the key element to monitor will be the evolution of the ADX; a sustained reading below 25 will continue to favor the range-bound structure, while a decisive move above this threshold could bring the Breakout scenario into focus.
For broader market context, readers can also review the latest related fundamental analysis for this pair.
For live market monitoring and the full interactive chart, readers can access the dedicated ETH Market Hub.
Disclaimer
CopyTradia provides technical analysis for informational and educational purposes only. This content does not constitute financial advice, investment recommendations, or trading signals. Cryptocurrency markets are highly volatile. Past performance is not indicative of future results. Always conduct your own research (DYOR) and consult a qualified financial advisor before making any investment decisions.


