ETH Breakout Technical Framework: Consolidation Tightens Below $2800 Resistance

This ETH breakout technical framework examines the current ETH/USDC structure in the context of support defense and weakening alternative frameworks. ETH/USDC is currently in a phase of tight consolidation around the $2725 level, following a strong upward impulse that defined the market in late September. The technical picture reveals a market holding its recent gains, with price action compressing into a narrow range. This pause is occurring within a context of significant underlying trend strength, as indicated by a high Daily ADX reading of 42.81. Momentum remains firmly bullish, with the Daily RSI at 64.51, suggesting that the current sideways movement is a pause rather than a reversal. This technical consolidation aligns with recent fundamental analysis highlighting a period of compressed volatility and building speculative interest, suggesting the market is coiling for a potential directional move. The price structure is now positioned well above key long-term moving averages, including the 200-day and 200-week EMAs, reinforcing a broadly constructive outlook as the market awaits its next catalyst.

Range & Rebound: Market Structure Assessment
The Range/Rebound framework is not retained for the current market structure, as the prevailing conditions are fundamentally misaligned with its core premise of stabilization within a defined range. The primary contradiction comes from the market's strong directional character. A D1 ADX reading of 42.81 signals a powerful, established trend, which is the antithesis of the ranging or consolidating environment this framework seeks to exploit. This daily reading is reinforced by the weekly context, where the W1 ADX has crossed into trending territory at 24.95 and price is actively testing its upper Bollinger Band, suggesting continued upward pressure rather than equilibrium. Furthermore, the 'rebound' component is inapplicable at present. Price is consolidating near its recent highs around 2700, far from any significant support zone. A plausible rebound scenario would require a pullback and a successful test of a structural floor, such as the confluence of the D1 middle Bollinger Band and the W1 S1 pivot around 2648, or the tactical 4H EMA 200 at 2566.47. For this framework to become relevant, the current trend would first need to show clear signs of exhaustion, such as the D1 ADX falling below 25, and price action would need to carve out a well-defined support level through a more substantial corrective phase.

ETH Breakout Technical Framework: Structural Catalyst Assessment
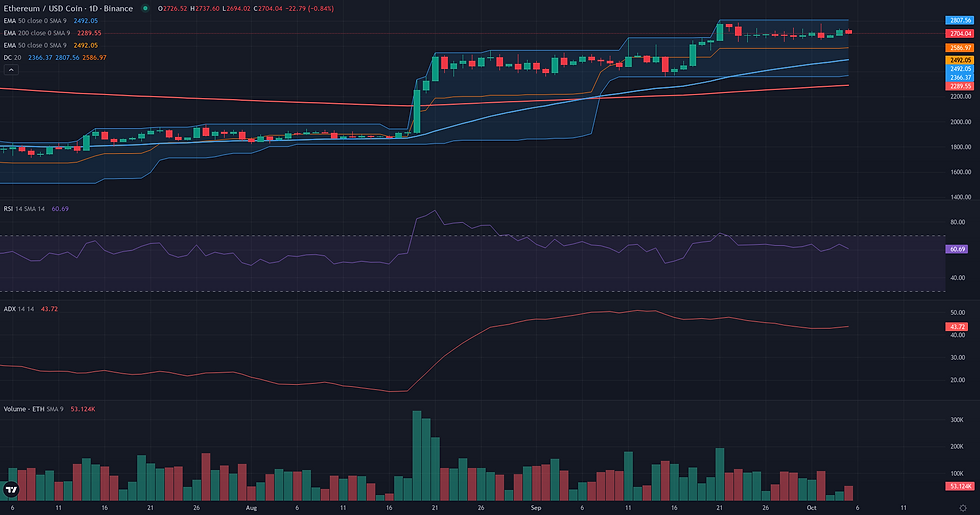
The Breakout framework appears technically plausible for ETH/USDC, based on a highly constructive market structure. The daily chart reveals a clear consolidation phase that has been forming over the past two weeks. Price is coiling in a tightening range directly beneath the significant resistance level of 2807.56, which marks the peak of the recent uptrend. This type of price compression is often a precursor to a significant directional move. The underlying trend strength is confirmed by a high ADX D1 reading of 42.81, indicating that the preceding move was powerful. Furthermore, momentum indicators are aligned across timeframes, with both the daily RSI (64.51) and weekly RSI (64.60) positioned in bullish territory but below overbought levels, suggesting ample room for a potential upward expansion. The weekly context reinforces this reading, as the price is now firmly established above its 200-week exponential moving average, a historically significant bullish threshold. The decreasing volume during the consolidation phase, evidenced by a Volume Oscillator of -33.05, adds weight to the hypothesis that this is a period of accumulation before a potential continuation, rather than a sign of exhaustion.
Continuation: Directional Flow Assessment
The technical structure for ETH/USDC presents a plausible continuation scenario, anchored in a well-defined daily uptrend that emerged in late August. Following a strong impulse move that peaked at 2807.56, the price has entered a multi-week consolidation phase. This sideways movement is currently holding firmly above key structural supports, including the daily EMA50 (2474.54) and, more significantly, the weekly EMA200 (2484.47), suggesting the underlying trend remains intact. The health of this consolidation is reinforced by momentum indicators. The daily ADX, at a high value of 42.81, confirms the strength of the preceding trend, while the daily RSI (64.51) remains in bullish territory without showing signs of exhaustion. Furthermore, the negative Volume Oscillator (-33.05) indicates that this pause is occurring on lower volume, a classic characteristic of a temporary pullback before a potential trend resumption. The alignment between the daily trend structure and the broader weekly context, which also shows strong bullish momentum (W1 RSI 64.60), forms the basis for this continuation reading. The primary tension is one of timing, as the market resolves its current consolidation, rather than a challenge to the dominant directional flow.
Comparative Framework Verdict
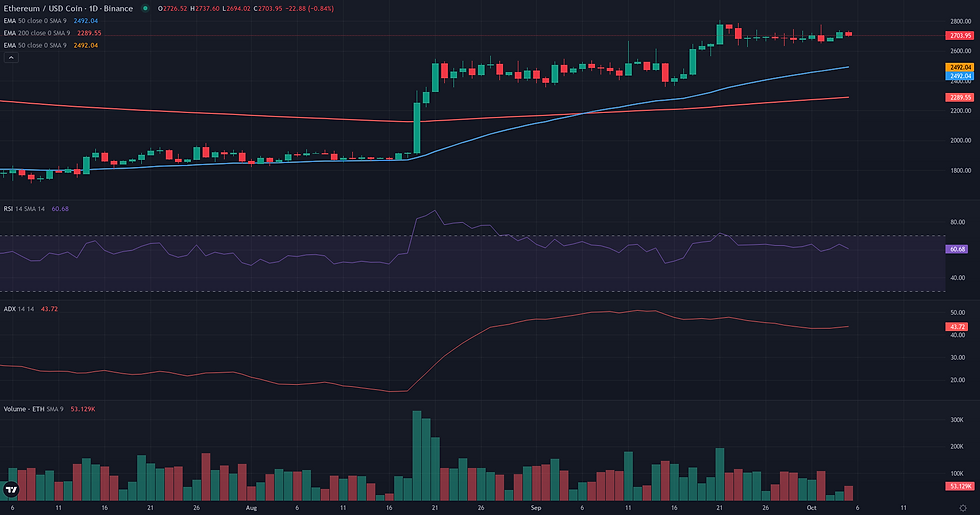
Comparing the three technical frameworks reveals a strong consensus around a directional, rather than a ranging, market structure. Both the Breakout and Continuation frameworks are deemed plausible, as they align on the core observation of a constructive consolidation phase within a powerful, pre-existing uptrend. They both identify the resistance zone around $2807 as the key threshold for a potential resumption of the trend, supported by strong momentum indicators like the high ADX and bullish RSI. The Breakout framework is considered dominant due to its slightly more precise definition of the potential trigger: a clean break of the recent highs. The Continuation framework is a very close secondary, describing the same underlying market dynamic from a slightly broader trend-following perspective. In stark contrast, the Range/Rebound framework is assessed as not plausible. Its core requirement for a non-trending, range-bound environment is directly contradicted by the high ADX readings on both daily and weekly timeframes. The price action near recent highs, rather than at a major support level, further invalidates the 'rebound' premise. Consequently, the analysis points towards a resolution of the current consolidation, with the market's behavior around the $2807 resistance being the critical area to monitor for signs of the next directional move.
For broader market context, readers can also review the latest related fundamental analysis for this pair.
For live market monitoring and the full interactive chart, readers can access the dedicated ETH Market Hub.
Disclaimer
CopyTradia provides technical analysis for informational and educational purposes only. This content does not constitute financial advice, investment recommendations, or trading signals. Cryptocurrency markets are highly volatile. Past performance is not indicative of future results. Always conduct your own research (DYOR) and consult a qualified financial advisor before making any investment decisions.


