ETH Breakout Technical Analysis: Price Coils Under $2800

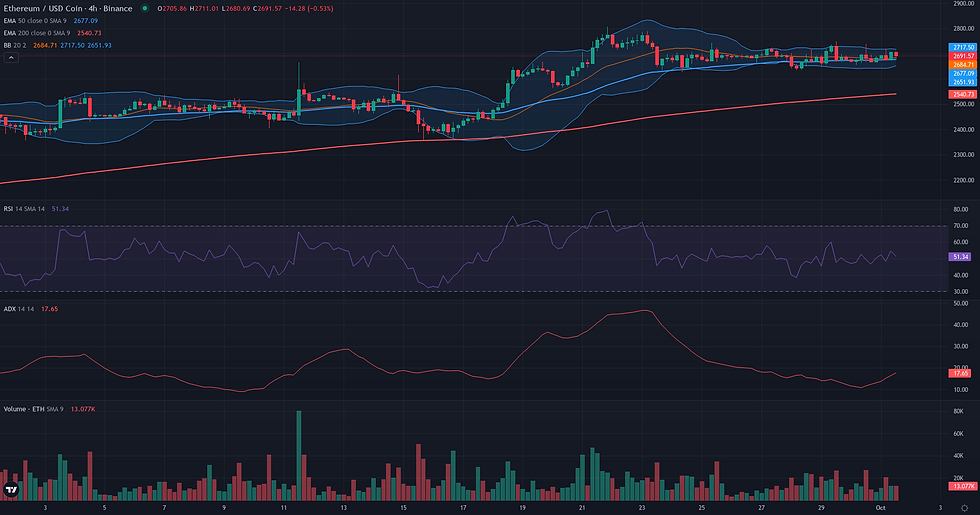
This ETH breakout technical analysis examines the current ETH/USDC structure in the context of support defense and weakening alternative frameworks. ETH/USDC is currently in a state of high-tension consolidation, trading around 2684 after a strong upward impulse met resistance near the 2807 level. The market structure shows price coiling in a tightening weekly range, holding firmly above key long-term supports like the 200-day (2245) and 200-week (2481) exponential moving averages. This sideways price action is occurring within a powerful underlying trend, confirmed by a high Daily ADX reading of 42.66, while the D1 RSI at 62.92 indicates sustained bullish momentum without being overextended. This technical consolidation aligns with recent fundamental observations of cooling market sentiment and a contraction in derivatives, suggesting a period of adjustment before the next directional move. The current price compression sets the stage for three distinct technical possibilities: a range-bound rebound, a continuation, or a decisive breakout.

Range & Rebound Resolution: Support and Friction Zones
The resolution of the Range/Rebound framework for ETH/USDC hinges on the market's reaction to the key support established in the 2611-2635 USDC validation zone. This area, defined by the recent daily low (2633.25) and weekly S1 pivot (2611.73), serves as the foundational support for the rebound thesis. The framework would lose its structural coherence if the price were to suffer a sustained breakdown, marked by a daily close below 2611 USDC. Such a move would negate the support cluster and suggest a bearish continuation rather than a rebound. For the rebound to gain traction, it faces a series of technical obstacles. The first friction zone lies between 2729 and 2750 USDC, a resistance area composed of the D1 R1 pivot and a cluster of recent highs. Clearing this level is the initial confirmation that buyers are taking control. A more formidable barrier is located between 2774 and 2808 USDC, which includes the W1 R1 pivot and the cycle high of 2807.56. This zone represents the upper boundary of the current broader range. If the rebound successfully navigates these friction points, the primary technical projection is the W1 R1 pivot at 2786.04. A sustained move above this level could open the path towards the W1 R2 pivot at 2883.95 as a higher structural reference. Confirmation of the rebound's strength would involve holding above 2750, while a rejection from this level followed by a drop below the D1 S1 pivot at 2647.84 would serve as a significant weakening signal.

ETH Breakout Technical Analysis: Structural Catalyst Assessment
The Breakout framework appears technically plausible for ETH/USDC, based on a highly coherent market structure. The primary feature is a well-defined consolidation pattern that has formed over the past eight trading sessions. Price is coiling in a tight range directly beneath the key resistance level of 2807.56, established by the 20-day Donchian Channel upper band. This type of price compression following a strong upward impulse is characteristic of a market preparing for a potential continuation move. The reading is strongly supported by momentum indicators. The Daily ADX, at a high value of 42.66, confirms the existence of a powerful underlying trend, while the Daily RSI at 62.92 indicates solid bullish strength without being overextended. This momentum is consistent on the weekly timeframe (W1 RSI at 63.76). Furthermore, the negative D1 Volume Oscillator (-10.25) points to a decrease in volume during this consolidation, a classic sign that selling pressure is low and accumulation may be underway. The broader weekly context reinforces this view, with the price holding firmly above its 200-week exponential moving average (2481.11), signaling a structurally sound long-term uptrend.

Continuation: Directional Flow Assessment
The technical structure for ETH/USDC presents a plausible continuation scenario. The primary daily trend is clearly bullish, a fact underscored by a strong ADX reading of 42.66, which indicates a well-established directional move. Following a powerful impulse that peaked at 2807.56, the price has entered a consolidation phase. This sideways movement appears constructive; it is occurring on relatively low volume (Volume Oscillator D1: -10.25) and is holding comfortably above key structural supports, including the D1 EMA 50 at 2435.87. This daily structure is reinforced by a favorable weekly context. The price has successfully reclaimed the W1 EMA 200 (2481.11), a significant long-term bullish development. The weekly momentum remains solid with an RSI of 63.76, suggesting the broader uptrend has room to run. The main qualifying factor is the current lack of immediate directional pressure, as evidenced by the tight, overlapping daily candles of the past week. However, this is interpreted as a healthy pause or re-accumulation phase rather than a structural weakness. The overall balance of evidence points towards a stable directional flow, awaiting a catalyst to resume its upward trajectory.

Comparative Framework Verdict
In the current market structure for ETH/USDC, all three analytical frameworks—Range/Rebound, Breakout, and Continuation—are deemed plausible, reflecting a pivotal moment of consolidation after a strong trend. However, a comparative analysis reveals a clear hierarchy of technical coherence. The Breakout framework emerges as the most dominant scenario. Its logic is built on the price coiling tightly beneath the well-defined structural resistance at 2807.56. This view is strongly supported by the high Daily ADX of 42.66, which the framework correctly interprets as a sign of a powerful underlying trend that is merely pausing. The absence of any listed weakening factors further strengthens its case. The Continuation framework is a close secondary. It shares the bullish bias of the Breakout but identifies a lower, less distinct validation zone around 2720-2750. While also plausible, it is slightly less compelling as it points to a resumption of the trend from within the consolidation rather than a decisive break of the cycle high. The Range/Rebound framework is the weakest of the three. Although the observed sideways price action supports a range thesis, its core logic is challenged by the high ADX reading. A strongly trending environment is typically unfavorable for the development of a stable range, making a simple rebound from the 2611-2635 support zone a less probable outcome compared to a trend-following resolution. The market's next move will likely be determined by whether buyers can overcome the 2807 resistance or if sellers can push the price back below the 2635 support.
For broader market context, readers can also review the latest related fundamental analysis for this pair.
For live market monitoring and the full interactive chart, readers can access the dedicated ETH Market Hub.
Disclaimer
CopyTradia provides technical analysis for informational and educational purposes only. This content does not constitute financial advice, investment recommendations, or trading signals. Cryptocurrency markets are highly volatile. Past performance is not indicative of future results. Always conduct your own research (DYOR) and consult a qualified financial advisor before making any investment decisions.


