ETH Breakout Analysis: Price Coils Below $2800 Resistance

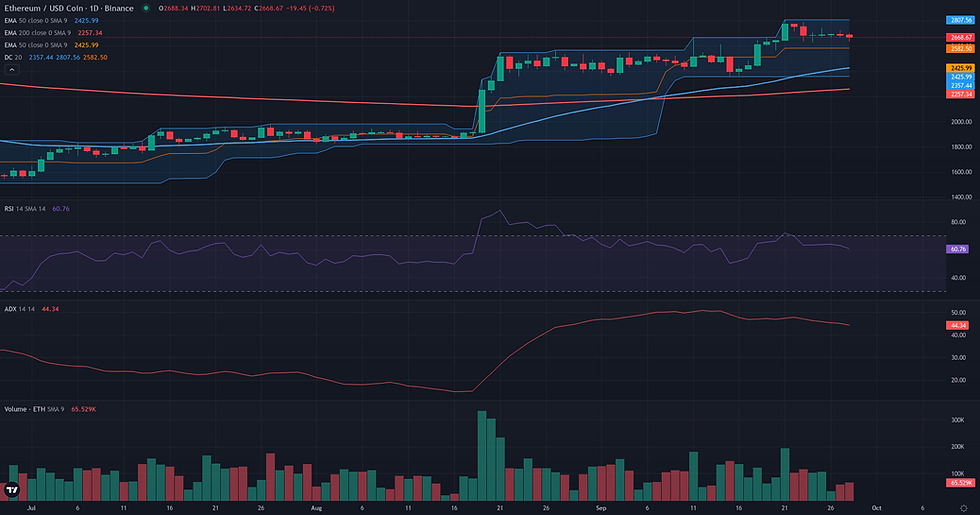
This ETH breakout analysis examines the current ETH/USDC structure in the context of support defense and weakening alternative frameworks. ETH/USDC is currently in a phase of tight consolidation following a strong bullish impulse that pushed the price to a recent high of $2807.56. The market is trading at approximately $2688, holding above key long-term moving averages, including the 50-day and 200-day EMAs, which confirms a strategically bullish posture. The underlying market structure is characterized by significant trend strength, with the D1 ADX registering a high value of 44.38. This indicates that the current sideways price action is more likely a pause within an ongoing trend rather than a reversal. Momentum remains robust, with the D1 RSI at 63.76, suggesting that buyers still retain control despite the recent lack of directional movement. This technical pause aligns with the latest fundamental analysis, which points to a cooling of market sentiment and a contraction in derivatives open interest, suggesting a period of structural adjustment after the recent rally. The key question for the week ahead is whether this consolidation will resolve into another leg up.

Range & Rebound: Market Structure Assessment
The Range/Rebound framework is currently not plausible for ETH/USDC. The market structure is dominated by a strong bullish trend, which is fundamentally at odds with the conditions of stabilization and range-bound activity this framework seeks to identify. The primary contradicting signal is the D1 ADX, which at a high value of 44.38, points unequivocally to a powerful, directional market. This reading is supported by a D1 RSI of 63.76, indicating robust bullish momentum with no signs of exhaustion. While the price has been consolidating for several days after reaching a high of 2807.56, and is currently testing the W1 Upper Bollinger Band (2722.96), these elements are insufficient to override the strong trend dynamic. This consolidation is better interpreted as a pause within an ongoing trend rather than the formation of a stable range. For the Range/Rebound framework to become relevant, a significant deceleration of the trend would be required, evidenced by the D1 ADX falling below 25. Furthermore, the establishment of a clear support level, potentially through a pullback towards the zone defined by the W1 EMA 200 (2481.11), would be necessary to provide a credible anchor for a rebound scenario.

ETH Breakout Analysis: Structural Catalyst Assessment
The Breakout framework appears technically plausible for ETH/USDC, based on a classic structural preparation pattern on the daily chart. The market has established a clear and significant resistance level at 2807.56, which corresponds to the high of September 21st and the current upper Donchian channel band. Following the test of this level, price has entered a tight consolidation phase for nearly a week, coiling just beneath the potential breakout point. This sideways action is supported by a constructive volume pattern, with the Volume Oscillator at -25.27% indicating that volume has decreased during this pause, a typical sign of energy accumulation before a potential continuation. The underlying trend strength is robust, as evidenced by a high D1 ADX reading of 44.38, while the D1 RSI at 63.76 shows healthy bullish momentum without being overextended. This daily structure is reinforced by a favorable weekly context, where the price is holding firmly above key long-term averages like the W1 EMA200 (2481.11). The only minor point of caution is a W1 ADX of 24.60, suggesting the weekly trend is still maturing, but this does not invalidate the compelling daily setup.
Continuation: Directional Flow Assessment
The technical structure for ETH/USDC presents a plausible case for a bullish continuation. The primary directional flow is clearly upward, anchored by a strong impulse that established a new swing high at 2807.56. This movement is supported by a high D1 ADX reading of 44.38, indicating a robust and established trend. Following this peak, the price has entered a consolidation phase, which appears constructive in nature. The pullback has remained relatively shallow, finding support around the 2635 area, and has been accompanied by a negative Volume Oscillator (-25.27), suggesting a healthy pause rather than a reversal driven by strong selling pressure. The broader weekly context reinforces this view, as the price is now trading decisively above its 200-week EMA (2481.11), a significant long-term bullish signal. The main qualifying factor is the current short-term indecision; the price is hovering around the Weekly Pivot (2709.64) with small-bodied daily candles, and the H1 chart shows a lack of immediate momentum. However, this appears to be a tactical pause within a strategically sound uptrend, making the continuation framework technically coherent.

Comparative Framework Verdict
Comparing the three strategic frameworks, a clear consensus emerges favoring directional, trend-following scenarios. Both the Breakout and Continuation frameworks are deemed plausible, while the Range/Rebound framework is considered not plausible given the current market dynamics. The Breakout framework stands out as the most dominant technical interpretation. It correctly identifies the critical resistance at the $2807.56 swing high and highlights the constructive, multi-day consolidation occurring just below this level. The accompanying decrease in volume during this period further strengthens the case for energy accumulation ahead of a potential upward resolution. The Continuation framework is a close secondary, sharing the same bullish bias. It also recognizes the strong underlying trend and the healthy pause in price action but sets a more immediate validation point. Its plausibility is high, but the Breakout framework’s focus on the more significant multi-day peak provides a clearer structural thesis. Conversely, the Range/Rebound framework is invalidated by the market's powerful trend strength. The D1 ADX reading of 44.38 is far above the threshold for a ranging market, making any contrarian or range-bound play technically unsubstantiated. For the coming sessions, market participants will likely monitor the consolidation boundaries, particularly the resistance at $2807.56, for signs of the next directional move.
For broader market context, readers can also review the latest related fundamental analysis for this pair.
For live market monitoring and the full interactive chart, readers can access the dedicated ETH Market Hub.
Disclaimer
CopyTradia provides technical analysis for informational and educational purposes only. This content does not constitute financial advice, investment recommendations, or trading signals. Cryptocurrency markets are highly volatile. Past performance is not indicative of future results. Always conduct your own research (DYOR) and consult a qualified financial advisor before making any investment decisions.


