ETH Breakout Analysis: Price Tests Key Resistance

This ETH breakout analysis examines the current ETH/USDC structure in the context of support defense and weakening alternative frameworks. ETH/USDC is currently at a critical juncture, testing significant resistance near the 1965 USDC level after a period of range-bound consolidation. The daily chart shows constructive short-term momentum, with the RSI at 63.47 and the price holding above its 50-day moving average. However, this bullish pressure is developing within a low-volatility environment, as indicated by a low ADX of 22.34, suggesting the market has not yet committed to a strong directional trend. This technical setup of building momentum against resistance aligns with recent fundamental analysis, which highlights a controlled ascent with realized volatility remaining below its 90-day baseline, suggesting a methodical test of current price ceilings rather than a speculative frenzy. The primary tension for the week ahead lies between this nascent daily strength and the persistent bearish context on the weekly timeframe, where key long-term moving averages remain as significant overhead obstacles.

Range & Rebound: Market Structure Assessment
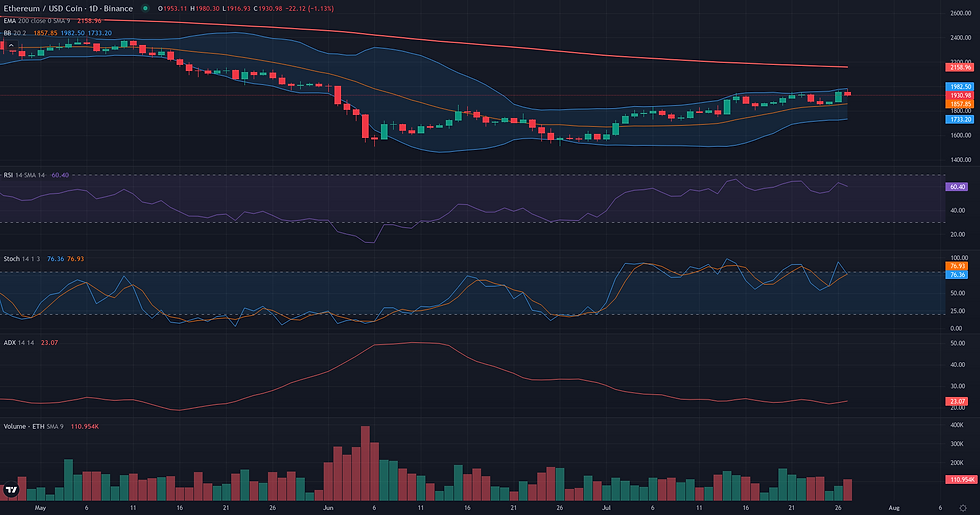
The Range/Rebound framework is currently assessed as not plausible for ETH/USDC. While the daily chart clearly shows the development of a consolidation range over the past several weeks, a condition confirmed by the low ADX reading of 22.34, the current price location is antithetical to the framework's core logic. The strategy seeks to identify stabilization and a potential rebound from the lower boundary of a defined range. At present, the price is actively testing the upper boundary of this range, near the 1965 USDC level, with short-term bullish momentum indicated by a D1 RSI of 63.47. This context is more aligned with a potential breakout scenario rather than a controlled reversal from support. For the Range/Rebound framework to become relevant, the market would first need to demonstrate a clear rejection from the current resistance area, followed by a structured descent back towards the support zone identified between roughly 1840 and 1875 USDC. Only upon a test of that lower zone, coupled with signs of bearish momentum exhaustion, would the conditions for a plausible rebound scenario be met.
ETH Breakout Analysis: Structural Catalyst Assessment
The Breakout framework presents a borderline case for ETH/USDC, characterized by a classic daily setup clashing with a challenging weekly context. On the D1 chart, the structure is constructive: price has spent the last two weeks consolidating in a range, and is now pressing directly against the upper boundary defined by the recent high of 1965.68. This compression is accompanied by a building D1 RSI of 63.47, suggesting momentum is aligning for a potential upward resolution. However, this promising local picture is tempered by significant headwinds from the weekly timeframe. The asset remains in a long-term downtrend, trading well below its W1 EMA50 and EMA200, and the W1 RSI at 43.79 fails to show any deep-seated strength. Furthermore, the recent push towards resistance was not supported by a decisive increase in volume, as indicated by a negative Volume Oscillator (-11.19). This tension between the clean D1 breakout pattern and the overarching weakness on the W1 chart makes the scenario highly conditional, warranting a 'borderline' verdict.
Continuation: Directional Flow Assessment
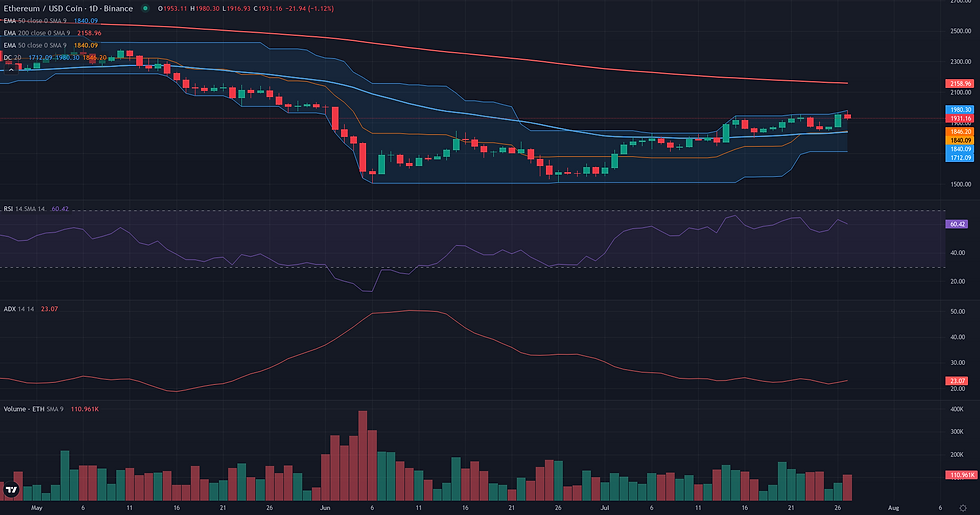
The technical structure for ETH/USDC presents a compelling but conflicted case for a bullish continuation, leading to a borderline assessment. On one hand, the daily chart displays a clear signal of renewed buying pressure with the strong breakout candle of July 26th, which pushed the price decisively above the recent consolidation range and the weekly pivot at 1920.11. This move is supported by a healthy D1 RSI of 63.47, suggesting solid momentum without being overextended. The micro-structure on the H1 timeframe further confirms the impulsive character of this ascent. However, this short-term bullishness must be weighed against a challenging long-term context. The price remains significantly below key bearish trend references, notably the D1 EMA 200 at 2229.64 and the W1 EMA 50 at 2426.50. This positioning suggests the current rally is, for now, a counter-trend move within a larger bearish structure. Furthermore, indicators of trend strength like the D1 ADX (22.34) and the D1 Volume Oscillator (-11.19) have yet to confirm the breakout with conviction. This creates a structural tension: while the immediate price action supports continuation towards the next resistance around 1998.67 (W1 R1), the overarching bearish context acts as a significant headwind, making the framework plausible but requiring careful validation.
Comparative Framework Verdict
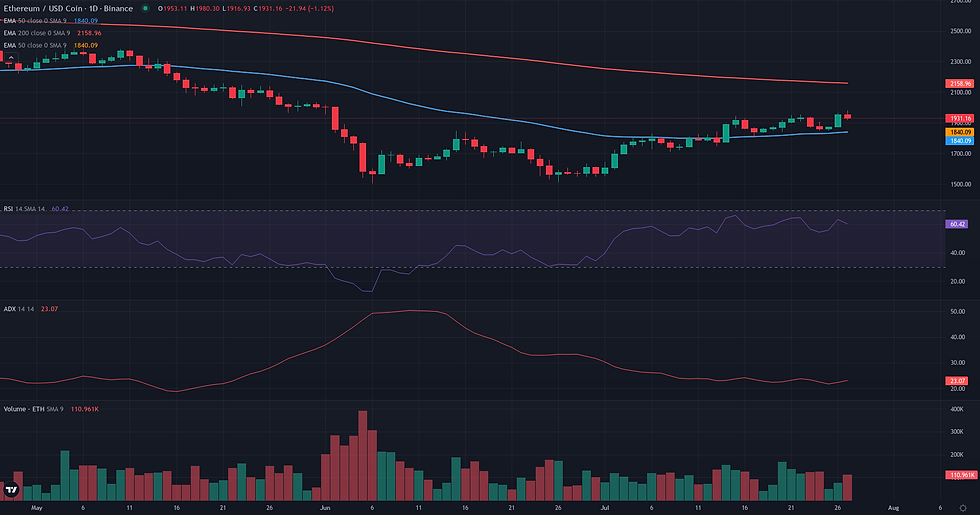
In this week's ETH technical analysis, two of the three strategic frameworks are assessed as borderline, reflecting a market caught between short-term bullish pressure and a broader bearish context. The Breakout and Continuation frameworks both capture the upside potential but are tempered by significant headwinds, while the Range/Rebound scenario is deemed not plausible. The Breakout framework emerges as the most relevant scenario, albeit with a 'borderline' rating. It correctly identifies the immediate technical challenge: the price consolidating directly below the key resistance at 1965 USDC. Its plausibility is conditional upon a decisive break, as the underlying weekly trend remains weak and recent volume has not been convincing. The Continuation framework is a close secondary, also rated 'borderline'. It focuses on the follow-through from the recent bullish impulse but faces the exact same structural challenges from the long-term bearish trend. Finally, the Range/Rebound framework is clearly not plausible. Its logic is based on a reversal from range support, which is the opposite of the current market situation where price is actively testing range resistance. The key determinant for the coming sessions will be the market's reaction at the 1965 USDC level; a sustained move above it would lend credence to the bullish frameworks, whereas a rejection would reinforce the existing range structure.
For broader market context, readers can also review the latest related fundamental analysis for this pair.
For live market monitoring and the full interactive chart, readers can access the dedicated ETH Market Hub.
Disclaimer
CopyTradia provides technical analysis for informational and educational purposes only. This content does not constitute financial advice, investment recommendations, or trading signals. Cryptocurrency markets are highly volatile. Past performance is not indicative of future results. Always conduct your own research (DYOR) and consult a qualified financial advisor before making any investment decisions.


