Dogecoin Range Rebound Analysis: Price Stagnates at 0.07 Support

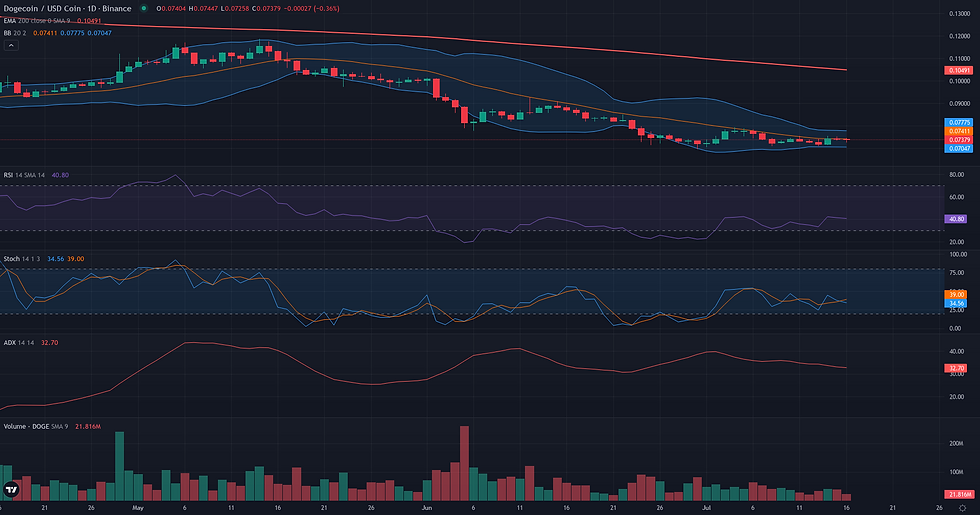
This Dogecoin range rebound analysis examines the current DOGE/USDC structure in the context of support defense and weakening alternative frameworks. DOGE/USDC is currently defined by a state of pronounced technical equilibrium, with price action tightly confined to a narrow range between 0.07 and 0.08 USDC for several weeks. The daily close at 0.07 USDC places the pair at the very floor of this consolidation, testing a significant support zone. This period of low volatility is reflected in weak directional momentum, with the daily RSI lingering below the neutral 50 mark at 41.47. While the broader market context remains bearish—evidenced by the price trading well below key long-term moving averages like the D1 200 EMA at 0.11—the immediate trend has clearly stalled. This technical stagnation aligns with the latest fundamental context, which highlights Dogecoin's persistent internal weakness and a prevailing negative sentiment in futures markets, explaining the current lack of bullish conviction. The market structure suggests a period of indecision, where neither buyers nor sellers have established control.

Dogecoin Range Rebound Analysis: Support and Friction Zones
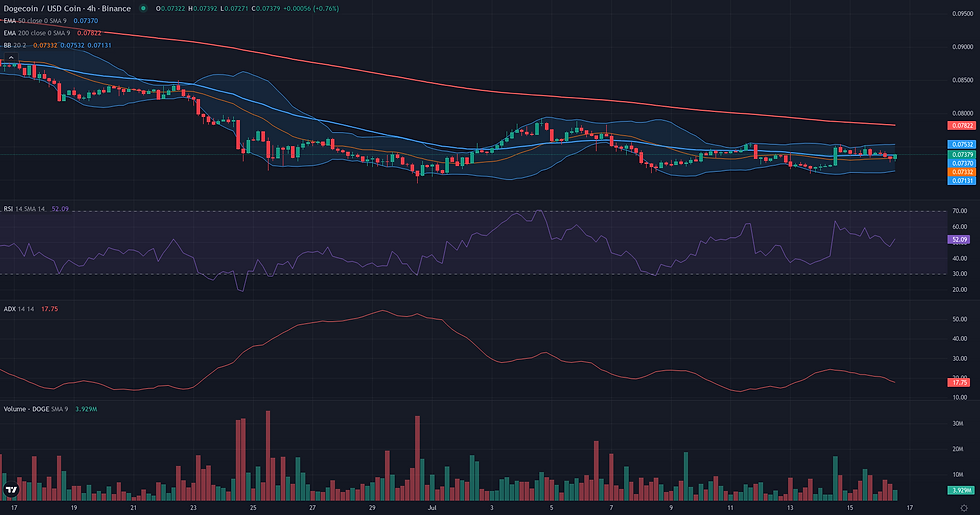
Following the plausible Range/Rebound framework identified for DOGE/USDC, the resolution path is defined by a clear and narrow price structure. The validation for a potential rebound begins with a sustained move above the daily middle Bollinger Band at 0.07 USDC, which would signal an initial shift in momentum towards the top of the range. The framework's coherence hinges on the integrity of the 0.07 USDC support level. A daily close below this critical floor would invalidate the rebound thesis, suggesting that the preceding downtrend is resuming. This level's importance is underscored by its confluence with weekly supports, making a breakdown a significant structural event. Conversely, the primary obstacle to a successful rebound is the dense resistance cluster at 0.08 USDC. This level acts as a major friction zone, aligning the top of the daily range with the D1 50-period EMA and the weekly pivot point. Multiple rejections on the 4-hour chart have already confirmed the selling pressure present here. A firm confirmation of the rebound would require a decisive daily close above this 0.08 USDC ceiling. Should the framework confirm by breaking this resistance, the first technical projection zone lies at 0.09 USDC, corresponding to the second weekly resistance level. A more distant structural reference is the daily 200-period EMA at 0.11 USDC. The scenario would weaken if price repeatedly fails to overcome the 0.08 USDC barrier, indicating buyer exhaustion within the range.
Breakout: Structural Catalyst Assessment
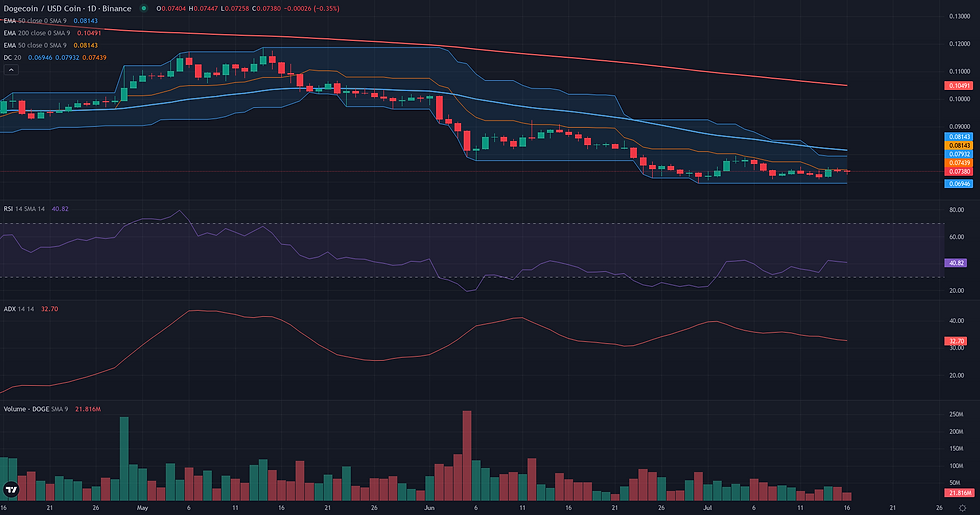
The current market structure presents a deceptive setup for the Breakout framework, leading to a 'not plausible' verdict. On the surface, the daily chart displays a textbook compression phase, a key prerequisite for a breakout. Volatility has contracted significantly, with the Bollinger Bands narrowing to a tight 0.07-0.08 range, and a very clear resistance ceiling has formed at 0.08. This level is technically significant, reinforced by the D1 EMA50, the 20-day Donchian high, and the 4H EMA200. However, this structural potential is completely undermined by a lack of directional intent. Momentum indicators fail to show any sign of accumulation or bullish pressure; the D1 RSI remains weak at 41.47, well within bearish territory. Compounding this, the broader weekly context is overwhelmingly negative, with price action deeply entrenched in a downtrend far below the W1 EMA50 (0.13) and EMA200 (0.12). This suggests the current D1 consolidation is more likely a pause or a continuation pattern within a larger bearish trend rather than the foundation for an upward reversal. For the Breakout framework to become relevant, a fundamental shift in momentum would be required, demonstrated by the price decisively reclaiming the 0.08 level on expanding volume and a corresponding rise in the RSI above 50.
Continuation: Directional Flow Assessment
The analysis of the DOGE/USDC market structure reveals a significant disconnect between the long-term context and the current daily price action, rendering the bearish Continuation framework not plausible at this time. While the weekly chart establishes a clear bearish environment, with price trading significantly below its key moving averages (W1 EMA50 at 0.13, W1 EMA200 at 0.12), the daily chart fails to exhibit the necessary directional flow. For the past three weeks, price has been confined to a tight consolidation range between approximately 0.07 and 0.08. This prolonged sideways movement, confirmed by low participation (D1 Volume Oscillator at -23.78) and neutral short-term momentum (H1 RSI at 48.41), represents a structural pause, not a continuation. The Continuation framework requires an active, stable trend to extend. Here, the trend has stalled. For this framework to become relevant again, the market would first need to resolve this range with a decisive breakdown below the 0.07 support, re-establishing a clear directional impulse.

Comparative Framework Verdict
Comparing the three technical frameworks, the market structure for DOGE/USDC presents a clear verdict: the Range/Rebound scenario is the only plausible interpretation. This framework is strongly supported by the prolonged daily consolidation observed for over three weeks within a tight 0.07 to 0.08 USDC channel. The lower boundary at 0.07 is a robust support zone, reinforced by weekly technical factors, while the 0.08 level forms a clear resistance ceiling. In contrast, both the Breakout and Continuation frameworks are deemed 'not plausible'. The Breakout scenario, despite the volatility compression, is undermined by a complete absence of bullish momentum, as indicated by a weak RSI and declining volume. The market is not building pressure for an upward move. Similarly, the Continuation framework is invalidated because the essential condition of a stable, ongoing trend is missing; the daily price action has unequivocally shifted from a downtrend into a sideways consolidation. Therefore, the most coherent view is that of a market in equilibrium. The resolution of this range, either through a breakdown below 0.07 or a reclaim of 0.08, will be critical in determining the next directional move.
For broader market context, readers can also review the latest related fundamental analysis for this pair.
For live market monitoring and the full interactive chart, readers can access the dedicated DOGE Market Hub.
Disclaimer
CopyTradia provides technical analysis for informational and educational purposes only. This content does not constitute financial advice, investment recommendations, or trading signals. Cryptocurrency markets are highly volatile. Past performance is not indicative of future results. Always conduct your own research (DYOR) and consult a qualified financial advisor before making any investment decisions.


