Dogecoin Range Rebound Analysis: Price Compresses at $0.07 Support

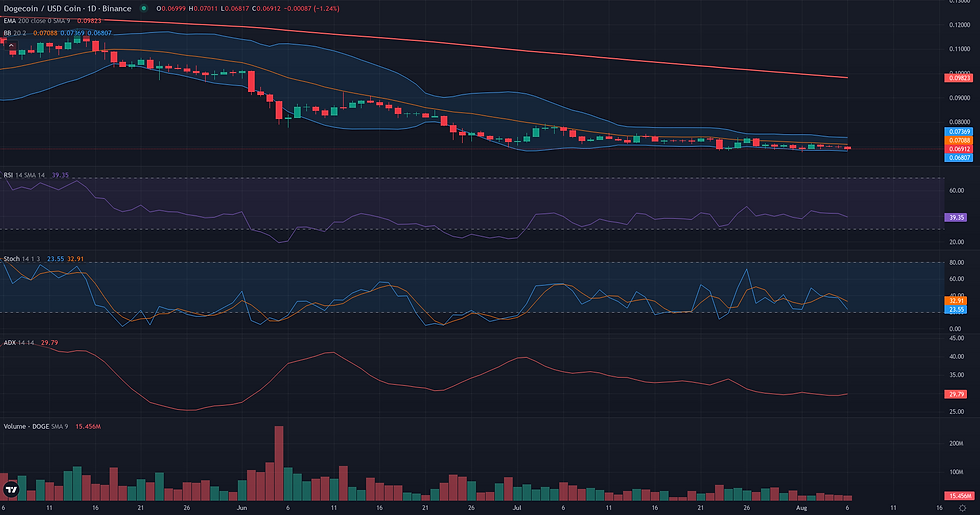
This Dogecoin range rebound analysis examines the current DOGE/USDC structure in the context of support defense and weakening alternative frameworks. DOGE/USDC is currently defined by a state of extreme structural compression, with its price locked in a tight consolidation around the $0.07 level for over a month. This period of inactivity has led to a collapse in daily volatility, as evidenced by a low NATR of 3.42 and an exceptionally tight D1 Bollinger Band Squeeze. Momentum remains weak, with the D1 RSI hovering at 42.05, reflecting the market's profound indecision and lack of directional conviction. This technical paralysis aligns with the latest fundamental analysis, which describes a market settling into a regime of lower volatility amidst deteriorating broader sentiment and weak internal positioning. While the immediate price action is flat, this consolidation is occurring within a larger, bearish weekly context, with the price trading significantly below its key long-term moving averages at $0.12. The current structure suggests that a significant, high-volatility move is becoming increasingly probable as energy builds within this narrow range.

Dogecoin Range Rebound Analysis: Support and Friction Zones
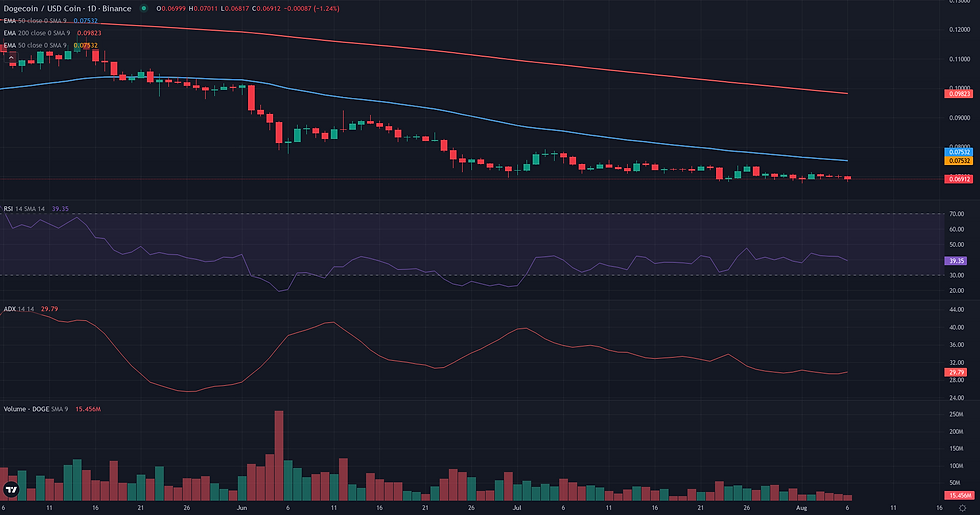
The resolution of the Range/Rebound framework for DOGE/USDC hinges on the breakout from an exceptionally tight and prolonged consolidation phase. Starting from the validation condition of a daily close above the 0.08 range resistance, we can define the key analytical zones. The framework would lose its coherence if the price were to break down instead, with the invalidation zone being a D1 close below the 0.07 support. This level has served as a floor for over a month, and a breach would signal a failure of the stabilization and a likely continuation of the prior downtrend. Should the framework validate with a move above 0.08, which is also the location of the D1 EMA 50, the path forward is not without obstacles. The first friction zone is located around 0.09, an area of previous structural highs from June that could attract sellers. If this level is cleared, the primary projection zone is the D1 EMA 200 at 0.10, a significant long-term moving average. A more extended, macro-level projection points towards the 0.12 area, where both the W1 EMA 50 and W1 EMA 200 form a major resistance confluence. Confirmation of the rebound would involve price establishing 0.08 as new support, while a weakening signal would be a 'false breakout' where price briefly pierces 0.08 but quickly falls back into the range, indicating a lack of follow-through from buyers.

Breakout: Structural Catalyst Assessment
The Breakout framework is currently not plausible for DOGE/USDC. The market structure presents a classic case of a necessary but insufficient condition: while the daily chart displays an extreme and prolonged phase of volatility compression, evidenced by completely flat Bollinger Bands at 0.07, it lacks the critical preparatory elements for a bullish breakout. The price is not consolidating beneath a well-defined resistance level; rather, it is dormant at the floor of its recent range. Momentum indicators show no sign of accumulation, with the D1 RSI at a neutral-bearish 42.05 and the Volume Oscillator at -25.43, suggesting a distinct lack of buying interest. Furthermore, the weekly context is strongly bearish, with the current price of 0.07 trading significantly below major weekly moving averages like the EMA50 at 0.12. For this framework to become relevant, the structure would need to evolve from its current state of inertia to one of active pressure, characterized by the formation and repeated testing of a clear resistance level, supported by rising momentum and volume.

Continuation: Directional Flow Assessment
The Continuation framework is assessed as not plausible for DOGE/USDC at this time. The primary reason for this conclusion is the market's structural paralysis on the daily timeframe. For over a month, price has been locked in an exceptionally tight consolidation range around the 0.07 level, a condition that directly contradicts the framework's core signature of a 'Stable Directional Flow'. While the weekly context provides a clear bearish backdrop—with price trading significantly below its key moving averages (W1 EMA50 at 0.12) and a strong weekly ADX (33.79) confirming the prior downtrend's strength—the daily price action shows this trend has come to a complete halt. This is not a typical pullback or pause but a state of extreme equilibrium, characterized by a collapse in daily volatility (NATR D1: 3.42) and declining volume. The daily RSI (42.05) is weak but lacks any downward momentum, reflecting the current indecision. For the Continuation framework to become relevant, the market would first need to break out of this prolonged consolidation. A decisive daily close below the 0.07 support or above the 0.08 resistance, accompanied by a significant expansion in volume and volatility, would be required to establish a new, readable directional impulse.
Comparative Framework Verdict
In this week's DOGE technical analysis, the market's structure presents a rare degree of clarity, leading to a definitive comparative verdict. The Range/Rebound framework is assessed as plausible and is the only one that coherently describes the current price action. Its relevance stems from the market's dominant feature: a month-long, low-volatility consolidation phase with a clearly defined support floor at $0.07 and resistance near $0.08. This prolonged period of balance and seller exhaustion is precisely the condition this framework is designed to analyze. Conversely, both the Breakout and Continuation frameworks are deemed not plausible. The Continuation framework fails because there is no active directional trend to continue on the daily timeframe; the prior downtrend has completely stalled. The Breakout framework is similarly invalid because, despite the extreme compression, the price is not building pressure under a resistance ceiling. Instead, it is dormant at the range lows, lacking the momentum and active testing required for a breakout setup. The current market is in a state of equilibrium, not pre-breakout tension. Therefore, the most relevant analytical lens is that of a potential rebound from the well-established $0.07 support. The resolution of this tight range—either a breakdown below support or a validated move above the $0.08 resistance—will be critical in defining the next directional phase for the pair.
For broader market context, readers can also review the latest related fundamental analysis for this pair.
For live market monitoring and the full interactive chart, readers can access the dedicated DOGE Market Hub.
Disclaimer
CopyTradia provides technical analysis for informational and educational purposes only. This content does not constitute financial advice, investment recommendations, or trading signals. Cryptocurrency markets are highly volatile. Past performance is not indicative of future results. Always conduct your own research (DYOR) and consult a qualified financial advisor before making any investment decisions.


