Dogecoin Positioning Shift Evident as Open Interest Contracts
- CopyTradia Intelligence

- May 18
- 3 min read
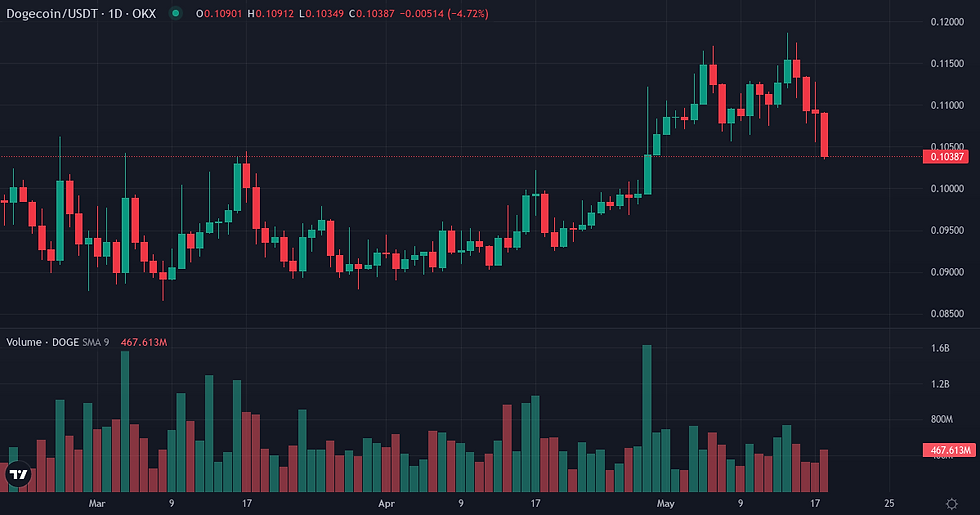
Dogecoin experienced a notable shift in its market dynamics this week, characterized by a spot price decline alongside a significant contraction in derivatives open interest. While the asset maintained positive relative performance against Bitcoin over the past 7 and 30 days, its volatility has decreased from its 90-day baseline, suggesting a period of consolidation in price action.
Spot Price and Volatility Contraction
Dogecoin's spot price registered a 6.43% decline over 24 hours and a 5.41% drop over the past seven days, contrasting with an 8.15% gain over the last 30 days. Despite the recent downturn, Dogecoin demonstrated positive relative performance against Bitcoin, appreciating by 5.3786% over seven days and 9.5209% over 30 days. Realized volatility for Dogecoin has notably contracted, with the 7-day figure at 41.71% and the 30-day at 40.26%, both significantly below the 90-day baseline of 62.31%. This indicates a reduction in price fluctuations. The 30-day correlation with Bitcoin stands at 0.7114, below its 90-day average of 0.8277, while its Beta against Bitcoin is 0.937. Volume momentum, at 0.458, suggests a decrease in trading activity relative to the 7-day average, aligning with the lower volatility.
Metric | Value |
DOGE Price | $0.10 (-6.43% 24h / -5.41% 7d / +8.15% 30d) |
Volume 24h | $1.48B |
Native Quote Vol. 24h | $26.0M |
Market Cap | $16.01B |
Market Cap Rank | 10 |
Circulating Supply | 154.29B DOGE |
ATH Distance | 85.81% below ATH |
Metric | Value |
DOGE/BTC Ratio | 0.00000100 |
Relative Perf. 7d vs BTC | +5.38% |
Relative Perf. 30d vs BTC | +9.52% |
Derivatives Open Interest and Funding
Speculative positioning for Dogecoin underwent a significant adjustment this week, marked by a 31.40% contraction in Open Interest (OI), bringing the total outstanding exposure to $0.229 billion, near its 90-day baseline of $0.223 billion. This substantial decrease in OI indicates a broad deleveraging or reduction in leveraged participation. The 30-day funding Z-score of -0.5618, below the 30-day average funding rate of 0.003736%, suggests a less aggressive long bias or even a slight short inclination among derivatives traders on average. Liquidation data for the past seven days shows a relatively balanced profile, with long liquidations totaling $39.2 million (53.0%) and short liquidations at $34.8 million (47.0%), consistent with the balanced directional skew observed over the 30-day average.

Metric | Value |
Funding Rate (current) | +0.0007% |
Funding Cumul. 7d | +0.0081% |
Open Interest | $0.23B (-31.40% 7d) |
Liq. 24h Longs | $1M |
Liq. 24h Shorts | $0M |
Liq. 7d Longs | $39M |
Liq. 7d Shorts | $35M |
Metric | Value |
Realized Vol 7d | +41.71% (90d avg: +62.31%) |
Realized Vol 30d | +40.26% |
Corr. BTC 30d | 0.7114 (90d avg: 0.8277) |
Beta vs BTC | 0.9366 |
Volume Momentum | 0.4578x |
Funding Z-Score 30d | -0.56σ |
Turnover Ratio | 0.0927 |
Liq. Intensity | 0.00462 |
Outlook: Monitoring Key Indicators
Monitoring conditions for the upcoming week will focus on whether the current Dogecoin positioning shift consolidates or reverses. A sustained contraction in Open Interest, particularly if accompanied by further negative funding rates, would suggest continued deleveraging and a potential search for a new equilibrium. Conversely, an expansion of Open Interest coupled with a return to positive funding rates could signal renewed speculative interest. The asset's ability to maintain its relative outperformance against Bitcoin, especially if broader crypto market sentiment remains in 'Fear' (currently at 28), will be a key indicator of autonomous strength. External macro events, including the FOMC Meeting Minutes on May 20th and the Philly Fed Manufacturing Index and Unemployment Claims on May 21st, could introduce broader market volatility that may interact with Dogecoin's internal dynamics, potentially influencing capital flows and positioning.
Indicator | Value | Variation |
Broad Dollar Index | 118.04 | flat (7d) |
US 10Y Yield | 4.47% | +0.05pp (7d) |
Fed Balance Sheet | $6729B | +$18,997M (7d) |
M2 Money Supply | $22,686B | +$58.7B (1m) |
Fear & Greed | 28 (Fear) | -21 pts (7d) |
Fear & Greed Index: Alternative.me
Dogecoin Weekly Takeaway
At week's close, Dogecoin exhibits an internal regime characterized by contracting volatility and a significant deleveraging in its derivatives market. The substantial reduction in Open Interest, alongside a slightly negative funding rate bias, points to a market that has shed a considerable portion of its leveraged exposure. While recent spot price action has been negative, the sustained relative strength against Bitcoin suggests an underlying resilience or selective capital rotation. The current state implies a market seeking a more stable footing, with speculative positioning having reset to levels near its longer-term baseline, setting the stage for potential re-accumulation or a new directional impulse.
Disclaimer
This article provides a fundamental analysis of Dogecoin's market dynamics and does not constitute investment advice or a recommendation to buy or sell any asset.


