DOGE Weekly Range Rebound Analysis: Support Holds at $0.09

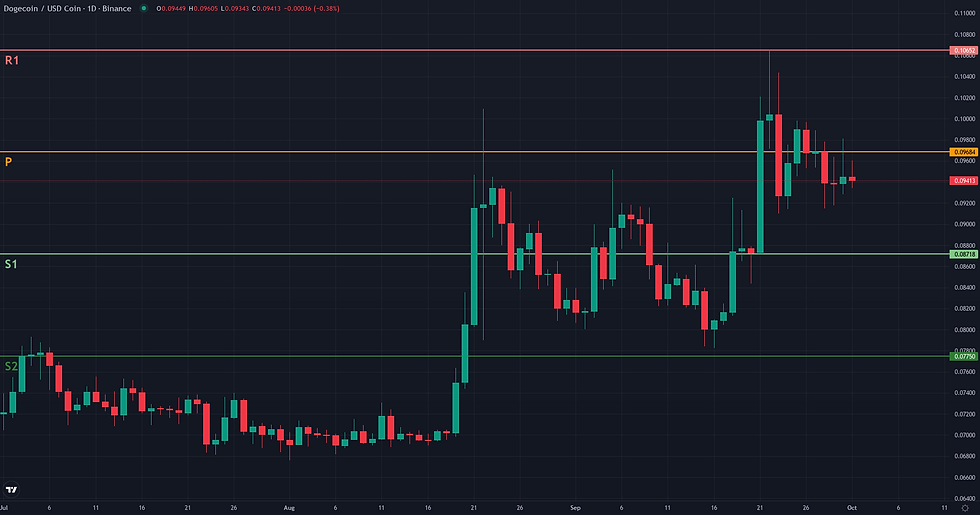
This DOGE weekly range rebound analysis examines the current DOGE/USDC structure in the context of support defense and weakening alternative frameworks. DOGE/USDC is currently navigating a critical technical juncture, with price action consolidating directly upon a significant support zone around the $0.09 mark. The market structure is defined by a clear battle between underlying bullish momentum and a formidable resistance ceiling. Indicators reflect this tension: the daily RSI stands at a neutral-to-bullish 56.62, while a relatively strong ADX of 33.74 suggests that the preceding trend still carries residual energy. This technical consolidation at a key support level follows a period of elevated internal volatility and a recent price decline after a month of gains, suggesting a potential rebalancing of market forces. The price is effectively caught between the structural support near $0.09, reinforced by long-term moving averages, and a heavy layer of weekly resistance located at $0.11. The resolution of this compression will likely dictate the pair's directional bias in the near term.
DOGE Weekly Range Rebound Analysis: Support and Friction Zones
Following the establishment of a plausible Range/Rebound framework, the resolution analysis focuses on the price action within the well-defined 0.08-0.11 range. The validation zone, identified as the 0.08-0.09 support cluster, remains the critical foundation for this thesis. The framework's coherence would be invalidated by a sustained daily close below this cluster, specifically under the 0.08 level, which would signify a structural breakdown of key daily supports. The immediate path for a potential rebound is not without obstacles. A significant friction zone is present at the 0.10 mark. This level is not just a psychological barrier but also a technical confluence, aligning with both the Daily and Weekly Pivot Points. The 4H chart data clearly shows this level acting as a short-term ceiling, and a decisive break above it is necessary for the rebound to gain credibility. The low 4H ADX (17.06) confirms this lack of directional pressure, reinforcing the ranging environment. Should the price successfully navigate the 0.10 friction, the primary technical projection zone lies at the formidable 0.11 resistance. This area represents the upper boundary of the macro range, heavily reinforced by the weekly R1 pivot, the 50-week EMA, and the 200-week EMA. A test of this level would mark a successful resolution of the rebound from the 0.09 support. Confirmation of the rebound's strength would come from a sustained hold above 0.10, while a persistent failure to break this level would be a clear sign of weakening momentum, putting the 0.09 support back into focus.

Breakout: Structural Catalyst Assessment
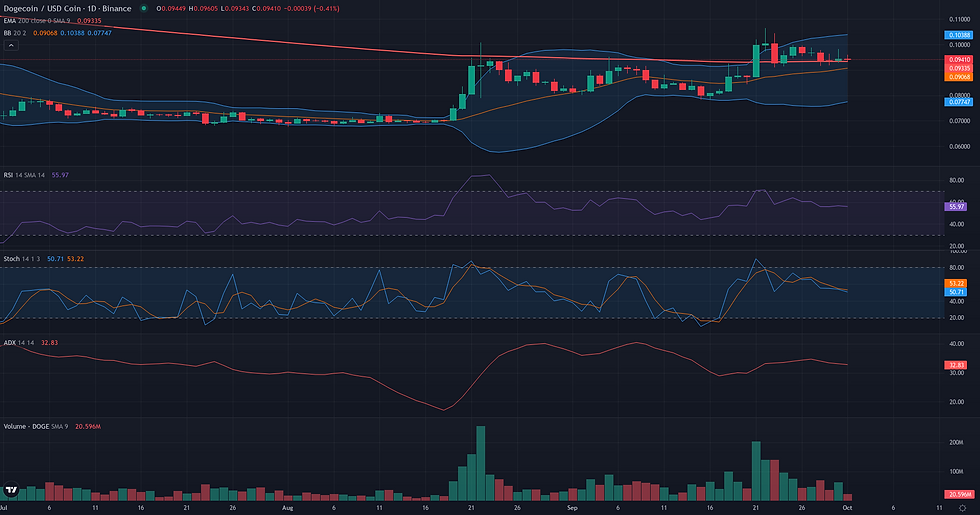
The Breakout framework for DOGE/USDC presents a borderline case, defined by a direct conflict between a constructive daily chart preparation and a formidable weekly resistance ceiling. On the daily timeframe, the structure is compelling: price has established a consolidation range roughly between 0.09 and 0.10, immediately following a sharp impulse that tested the 0.11 level. This price action is supported by a bullish momentum reading (RSI D1 at 56.62) and a strengthening trend indicator (ADX D1 at 33.74), suggesting technical readiness for another upward attempt. However, the significance of the 0.11 level cannot be understated, as it represents the primary limiting factor. This level is not merely a recent high (Donchian 20 D1 upper) but a major confluence of long-term resistance, precisely where the weekly 50-period and 200-period EMAs are located. A breakout would require overcoming this significant technical barrier. Furthermore, the recent decline in volume, reflected in a negative D1 Volume Oscillator (-14.44), adds a layer of uncertainty, as it signals a lack of immediate buying pressure. The current market structure is therefore a standoff: a bullish daily pattern challenging a major weekly obstacle.

Continuation: Directional Flow Assessment
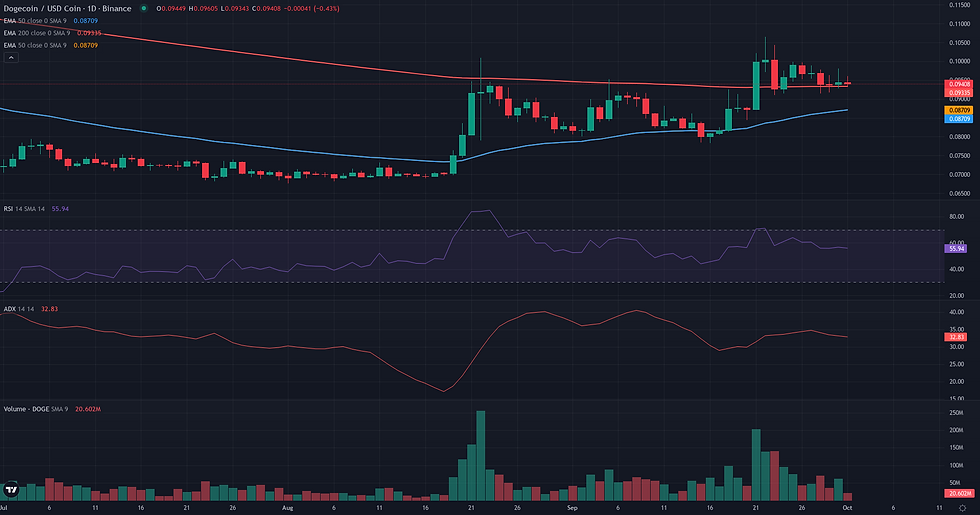
The Continuation framework for DOGE/USDC is currently borderline, reflecting a significant tension between a constructive daily chart and a formidable weekly resistance. The daily structure is encouraging for a continuation scenario: following a strong impulse from 0.08 to a high of 0.11 in late September, the price has entered a consolidation phase. This consolidation is occurring directly on top of a key support confluence at 0.09, where both the D1 EMA 50 and EMA 200 reside. Momentum indicators support this view, with the D1 ADX at 33.74 confirming a trending environment and the D1 RSI at a healthy 56.62. However, the primary limiting factor is the heavy resistance at 0.11. This level is not arbitrary; it aligns with the EMA 50 W1, EMA 200 W1, and the weekly R1 pivot, and it has already served as the rejection point for the recent rally. Therefore, while the daily pullback appears healthy, any attempt at continuation faces an immediate and significant structural obstacle. The current indecision is reflected on the H1 timeframe, where the price is tightly range-bound. The resolution of this conflict—either a failure at the 0.09 support or a decisive break through the 0.11 resistance—will determine the next directional move.
Comparative Framework Verdict
In assessing the three strategic frameworks, the Range/Rebound scenario emerges as the most plausible and immediately relevant technical map for DOGE/USDC. This framework is anchored by the current price action, which is actively testing a robust support cluster between $0.08 and $0.09. This zone's strength comes from a confluence of key daily and weekly indicators, providing a logical foundation for price stabilization. The well-defined resistance at the $0.11 level further reinforces the coherence of a range-bound market structure, containing price action within these clear boundaries. Conversely, both the Breakout and Continuation frameworks are rated as borderline. While they correctly identify a constructive daily setup—a consolidation above key moving averages with supportive momentum—their plausibility is significantly diminished by the same factor that defines the range: the formidable weekly resistance at $0.11. Both scenarios require a decisive breach of this heavy technical barrier, an event for which there is currently insufficient evidence, particularly given the lack of strong volume conviction. Therefore, these frameworks represent potential future developments rather than the current dominant market state. For now, the market's ability to hold the $0.09 support pivot remains the key element to monitor, as a failure here would weaken the range thesis and alter the technical landscape.
For broader market context, readers can also review the latest related fundamental analysis for this pair.
For live market monitoring and the full interactive chart, readers can access the dedicated DOGE Market Hub.
Disclaimer
CopyTradia provides technical analysis for informational and educational purposes only. This content does not constitute financial advice, investment recommendations, or trading signals. Cryptocurrency markets are highly volatile. Past performance is not indicative of future results. Always conduct your own research (DYOR) and consult a qualified financial advisor before making any investment decisions.


