DOGE/USDC Range Rebound: Support at $0.08 Tested

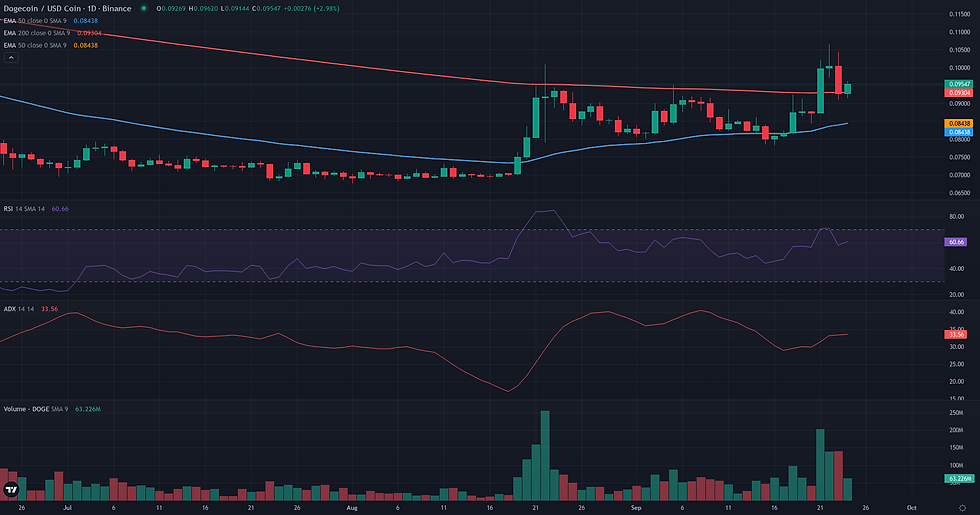
This DOGE/USDC range rebound examines the current DOGE/USDC structure in the context of support defense and weakening alternative frameworks. DOGE/USDC is currently navigating a critical technical juncture, pivoting around the $0.09 level after a powerful upward impulse was decisively rejected. The daily chart shows price action consolidating near its 200-day EMA, a classic sign of market equilibrium following a volatile move. Momentum indicators reflect this conflict: the daily ADX at 34.26 confirms a recently trending environment, while the daily RSI at 57.76 has pulled back from stronger bullish territory, indicating a pause. This technical setup follows a period of fundamental shifts, including a significant expansion in open interest and a move into a higher volatility regime, which fueled the recent, sharp price movements. The market is now caught between the memory of the recent rally and the strong selling pressure from overhead resistance, creating a complex structure where range-bound, continuation, and breakout scenarios present conflicting probabilities. The key question for the coming week is whether the support established during the ascent can absorb this pullback or if the rejection signals a broader reversal.
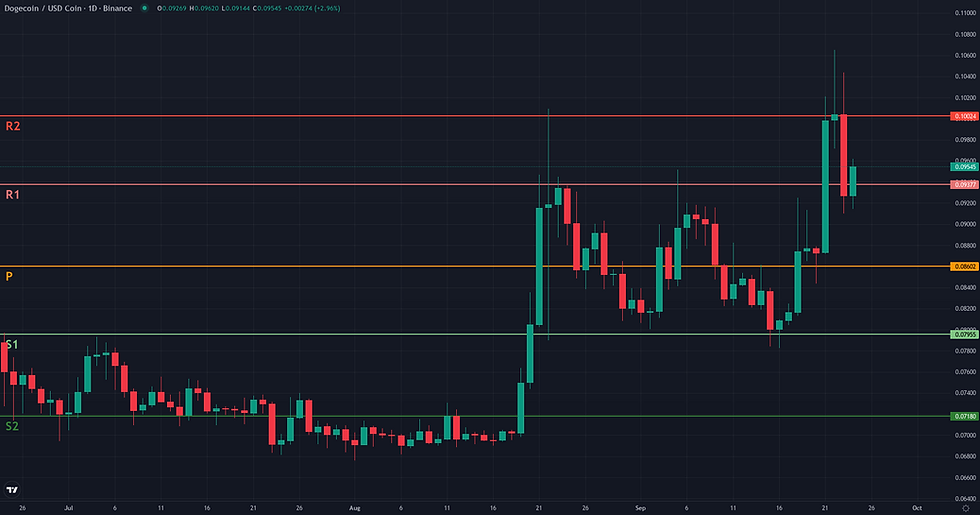
DOGE/USDC Range Rebound: Support and Friction Zones
The resolution of the Range/Rebound framework for DOGE/USDC hinges on the defense of the 0.080 validation zone. This level represents the floor of the current daily range and is a critical technical confluence, supported by the D1 EMA 50 and the D1 S2 pivot. The framework would lose its coherence and be invalidated if the price were to secure a daily close below this 0.08 support, signaling a structural breakdown rather than a rebound. Following the strong rejection from the upper part of the range, confirmed by potent bearish 'eveningstar' patterns on the D1 chart, a test of this 0.08 support appears likely. A successful rebound from this level would face its first significant obstacle, or friction zone, at the 0.09 midpoint. This area, marked by the D1 EMA 200, has acted as a center of gravity for the price and must be reclaimed to show buyer strength. Beyond that, the 0.10 level stands as the next friction point, representing the range's upper boundary. If the rebound gains momentum and clears these hurdles, the primary projection zone is the formidable 0.11 resistance cluster. This level is defined by the W1 EMA 200 and W1 EMA 50, which previously halted the advance and remains the most significant ceiling. Confirmation of the rebound requires a decisive bounce from 0.08 and a reclaim of 0.09, while a weak reaction at the support would be a clear weakening sign.
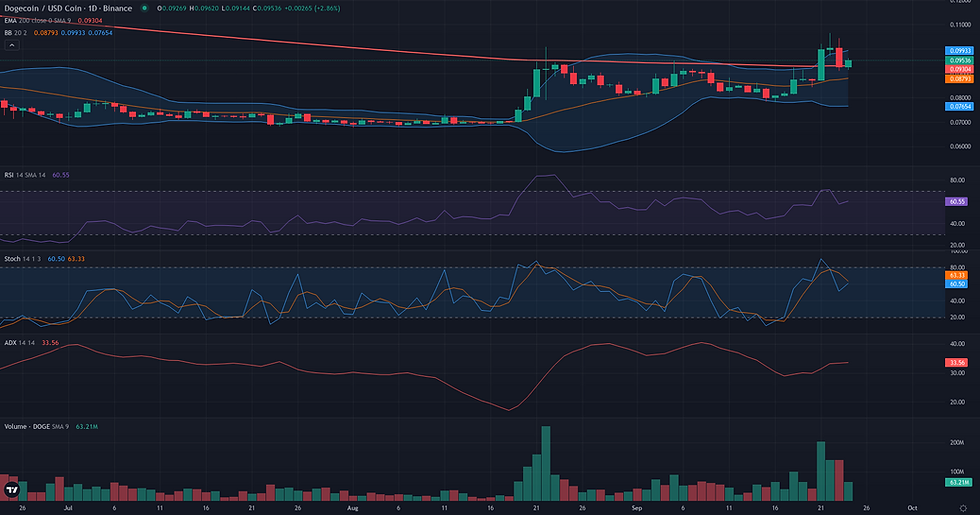
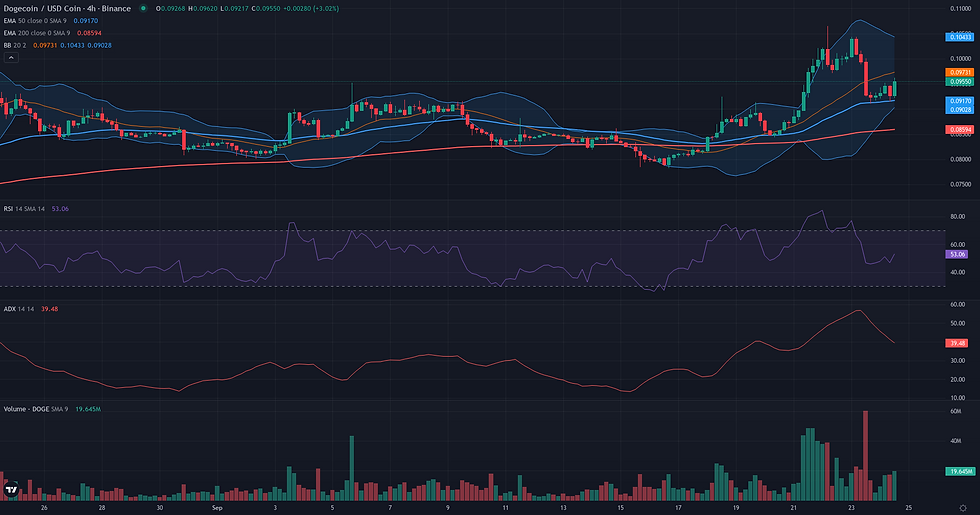
Breakout: Structural Catalyst Assessment
The Breakout framework is currently assessed as not plausible for DOGE/USDC. While the price recently made a dynamic push towards the 0.11 area, a level defined by the 20-day Donchian upper channel, the subsequent price action signals rejection rather than preparation for a structural break. This 0.11 level represents a formidable resistance confluence, aligning not only with the daily breakout threshold but also with major weekly moving averages (EMA 50 and EMA 200). Instead of consolidating beneath this ceiling, the market printed strong bearish reversal patterns, specifically an evening star formation, on high volume. This suggests that selling pressure overwhelmed buying interest at this key juncture. Furthermore, the weekly context lacks bullish conviction, with the Weekly RSI remaining below the 50 midline. For the Breakout framework to become relevant, the market would first need to absorb this recent selling pressure and establish a new phase of consolidation directly under the 0.11 resistance, thereby invalidating the current reversal signals.
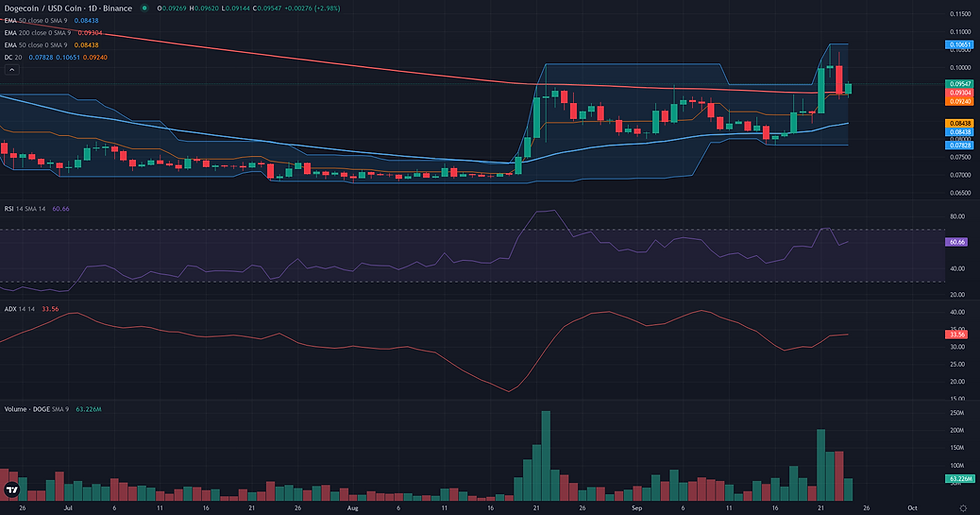
Continuation: Directional Flow Assessment
The technical structure for DOGE/USDC presents a conflicted scenario, rendering the Continuation framework borderline. On one hand, the market recently produced a powerful bullish impulse, breaking out from the 0.08-0.09 range to a high of 0.11. This move was supported by a significant volume increase (Volume Oscillator D1: 51.89) and established a trending environment (ADX D1: 34.26). Price currently holds above the D1 EMA 50 (0.08) and is testing the D1 EMA 200 (0.09) as support, which are constructive elements for a potential continuation. However, this bullish momentum faces considerable headwinds. The rally was sharply rejected from the 0.11 level, a zone of confluent weekly resistance defined by the W1 EMA 50 and W1 EMA 200. This rejection has formed a potent bearish 'Evening Star' candlestick pattern on the daily chart, signaling a potential trend reversal. This structural weakness is compounded by a lack of supportive momentum on the weekly timeframe (W1 RSI: 47.09) and visible selling pressure on the hourly chart (H1 RSI: 39.20). The immediate plausibility of a continuation now hinges on whether the support at 0.09 can absorb this selling pressure and serve as a new base for another upward leg.
Comparative Framework Verdict
Comparing the three technical frameworks, the Range/Rebound scenario emerges as the most plausible. This view is supported by the clear price containment between support around $0.08 and resistance near $0.10. The recent sharp rejection from the $0.11 weekly resistance zone, accompanied by strong bearish candlestick patterns, validates the upper boundary of this range and sets the stage for a potential rotation back towards the $0.08 support floor. A successful defense of this level would confirm the range-bound structure. The Continuation framework is considered borderline. While it correctly identifies the strong bullish impulse that initiated the recent move, its plausibility is significantly weakened by the potent reversal signals at a major weekly resistance level. The framework's viability now depends entirely on price holding the $0.09 pivot as support, a condition that is currently being tested. Finally, the Breakout framework is assessed as not plausible. The price action at the key $0.11 resistance was one of clear rejection, not the consolidation and compression typically required for a structural breakout. The market has moved away from the breakout level, invalidating this scenario for the time being. Consequently, market analysis will focus on the price action at the $0.08 support to determine whether the established range holds or a new directional phase begins.
For broader market context, readers can also review the latest related fundamental analysis for this pair.
For live market monitoring and the full interactive chart, readers can access the dedicated DOGE Market Hub.
Disclaimer
CopyTradia provides technical analysis for informational and educational purposes only. This content does not constitute financial advice, investment recommendations, or trading signals. Cryptocurrency markets are highly volatile. Past performance is not indicative of future results. Always conduct your own research (DYOR) and consult a qualified financial advisor before making any investment decisions.


