DOGE/USDC Range Rebound Analysis: Price Challenges Ceiling

This DOGE/USDC range rebound analysis examines the current DOGE/USDC structure in the context of support defense and weakening alternative frameworks. DOGE/USDC is currently at a critical juncture after experiencing a month of exceptionally low volatility and extreme price compression around the 0.07 support level. This prolonged period of market equilibrium, confirmed by a very low Daily ADX reading of 18.93, appears to be resolving as upward momentum builds. The Daily RSI has surged to 63.77, indicating a significant shift in buying pressure that is now testing the upper boundary of this consolidation zone. This technical state of extreme compression aligns with the latest fundamental analysis for DOGE/USDC, which describes a market defined by suppressed realized volatility and minimal price movement. Despite these initial bullish signs, the broader market context remains cautious, with the price trading below key long-term resistance levels, including the 200-day EMA at 0.09. The current price action suggests a potential transition from a range-bound state to a new directional phase, with the immediate price levels being closely watched for confirmation.

DOGE/USDC Range Rebound Analysis: Support and Friction Zones
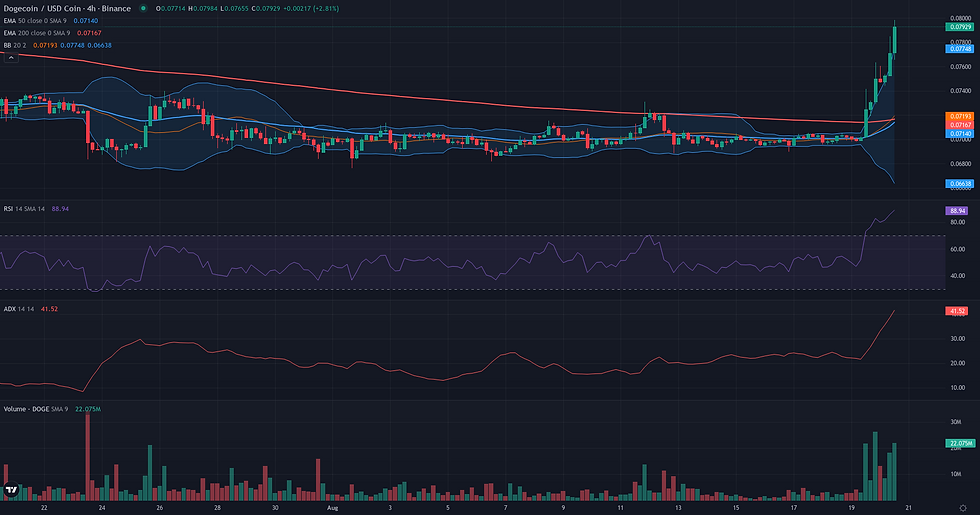
Starting from the validation zone of a daily close above 0.08 USDC, the framework's resolution is now actively being tested. The price is attempting to break out from its month-long consolidation base at 0.07 USDC, a move supported by a sharp increase in 4H volume and a strengthening 4H ADX (38.52). This indicates conviction behind the exit from the range. The primary condition that would invalidate this rebound framework is a definitive failure of this breakout, marked by a daily close back below the 0.07 USDC support. Such a move would not only reject the upward thrust but would also signal a breakdown from the entire consolidation structure. Before any significant upside can be considered, the framework faces immediate friction. The breakout level of 0.08 USDC itself, which aligns with daily pivots, is the first test, especially given the extremely overbought 4H RSI at 85.73 suggesting short-term exhaustion. The next, more formidable obstacle is the D1 200-period EMA at 0.09 USDC, a key structural resistance. Should the breakout sustain and overcome these friction zones, the first logical projection area is the 0.10 USDC level, a resistance zone visible on the weekly chart. A more extended, successful rebound would target the macro resistance cluster at 0.12 USDC, defined by the weekly 50 and 200-period EMAs. Confirmation of the framework requires holding above 0.08, while a fall back below it would be a clear weakening signal.

Breakout: Structural Catalyst Assessment
The Breakout framework for DOGE/USDC presents a borderline case, defined by a stark contrast between a potent daily setup and a restrictive weekly context. On the daily chart, the market has undergone an extraordinary phase of compression, with price holding flat at 0.07 for nearly a month. This prolonged equilibrium is visually confirmed by the Bollinger Bands, which have squeezed into a single line at 0.07, signaling a state of extremely low volatility often preceding a sharp expansion. The first sign of this potential expansion emerged on the last candle, which spiked to 0.08—the top of the 20-day Donchian channel—on a notable increase in volume. This action has pushed the D1 RSI to 63.77, indicating a sudden surge in buying interest. However, this nascent bullish pressure faces significant headwinds. The weekly chart reveals a strong underlying downtrend, with the current price pinned far below key moving averages like the W1 EMA50 at 0.12. Furthermore, the daily ADX at 18.93 shows the market is not currently trending, meaning this breakout would be an attempt to initiate a new trend rather than continue an existing one. The plausibility of the framework hinges on whether the explosive potential stored in the D1 compression can overcome the gravitational pull of the broader bearish weekly structure.

Continuation: Directional Flow Assessment
The Continuation framework is assessed as not plausible for DOGE/USDC at this time due to a fundamental contradiction with the market's current structure. The framework seeks a 'Stable Directional Flow,' yet the daily chart reveals a prolonged period of consolidation, with price action remaining almost perfectly flat at 0.07 for nearly a month. This lack of directional impetus is quantitatively confirmed by the D1 ADX indicator, which stands at a very low 18.93, signaling a non-trending or range-bound environment. The recent spike to 0.08, while notable for its volume, currently appears as an isolated volatility event rather than the beginning of a sustainable trend. This view is reinforced by the overbought H1 RSI at 81.56. Furthermore, the weekly context is explicitly bearish; the price is trading significantly below its W1 EMA50 and EMA200 (both at 0.12), and the W1 ADX (34.83) reflects the strength of the preceding downtrend. Therefore, the current market phase is one of pause and compression, not continuation. For this framework to become relevant, the market would first need to establish a new, clear directional trend out of the current range.

Comparative Framework Verdict
In comparing the three strategic frameworks, the Range/Rebound scenario emerges as the most plausible technical narrative for DOGE/USDC. This framework accurately captures the market's evolution from a month-long, stable consolidation at the 0.07 weekly support level to the current breakout attempt. Its plausibility is reinforced by the combination of bearish exhaustion signals on the weekly chart and nascent bullish momentum on the daily chart, providing a complete and coherent picture of the ongoing price action. The Breakout framework is considered borderline. While it correctly identifies the potential for a volatility expansion from the tight compression, its assessment is tempered by the fact that any upward move is directly counter to a strong, established weekly downtrend. This makes it a valid but more conflicted perspective. The Continuation framework is deemed not plausible, as the market's primary characteristic is a complete lack of a directional trend, evidenced by a very low ADX. The market is in a consolidation phase, not a trending one. The key factor to monitor now is whether the price can sustain its move above the 0.08 ceiling. A successful hold would lend credence to the rebound thesis, while a rejection would suggest a return to the established range.
For broader market context, readers can also review the latest related fundamental analysis for this pair.
For live market monitoring and the full interactive chart, readers can access the dedicated DOGE Market Hub.
Disclaimer
CopyTradia provides technical analysis for informational and educational purposes only. This content does not constitute financial advice, investment recommendations, or trading signals. Cryptocurrency markets are highly volatile. Past performance is not indicative of future results. Always conduct your own research (DYOR) and consult a qualified financial advisor before making any investment decisions.


