DOGE Technical Analysis: Consolidation Tightens Between Rebound and Continuation Scenarios

This DOGE technical analysis examines the current DOGE/USDC structure in the context of support defense and weakening alternative frameworks. DOGE/USDC is currently defined by a state of extreme consolidation, with price action tightly contained within the 0.07 to 0.08 range for over a month. The market is testing the lower boundary of this channel, closing the last daily session at 0.07. This price compression is reflected in momentum indicators, with the D1 RSI at a weak 41.42, suggesting a lack of immediate directional conviction. However, the D1 ADX remains elevated at 32.70, a remnant of the prior downtrend's strength, indicating that underlying trend energy has not fully dissipated. This technical picture of contracting volatility aligns with recent fundamental analysis, which highlights a market grappling with directional conviction amidst increasing open interest but negative funding rates. The current structure presents a clear inflection point, where the prolonged sideways movement must resolve, either by respecting the established support or by succumbing to the broader bearish market context.

DOGE Technical Analysis: Technical Framework Assessment
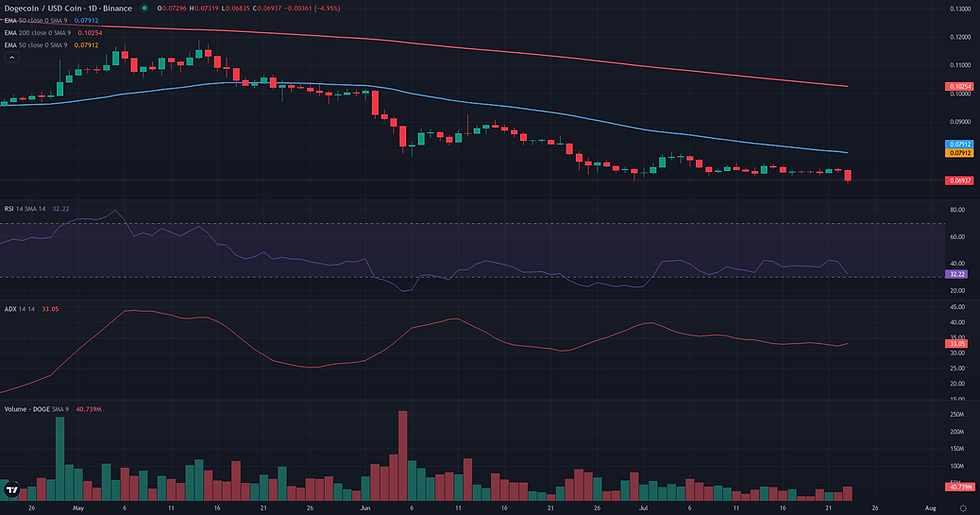
The DOGE/USDC Range/Rebound framework is currently in a state of extreme consolidation, awaiting a clear resolution. The validation for this scenario remains a sustained daily close above the range ceiling at 0.08 USDC. This level represents the critical threshold where buying pressure would confirm a structural shift. The resolution path from this point is framed by several key technical zones. The invalidation of the rebound hypothesis is clearly defined: a daily close below the range floor at 0.07 USDC. Such a move would break the month-long support and likely signal a continuation of the prior downtrend. Should the framework validate by breaking above 0.08, it would immediately encounter its first friction zone, which is the 0.08 level itself, reinforced by the D1 EMA 50. A successful move past this area would then target the 0.09 zone, a previous support/resistance level. Beyond these initial hurdles, the primary projection zone for a confirmed rebound is the D1 EMA 200, located at 0.10. This long-term moving average represents a significant structural landmark and a logical area for the rebound to be tested. Confirmation of the framework's strength would be seen if the price holds above 0.08 after the initial break, turning former resistance into support. Conversely, a weakening signal would be a 'bull trap'—a brief spike above 0.08 that fails to hold into the daily close, suggesting the rebound lacks sufficient momentum.

Breakout: Structural Catalyst Assessment
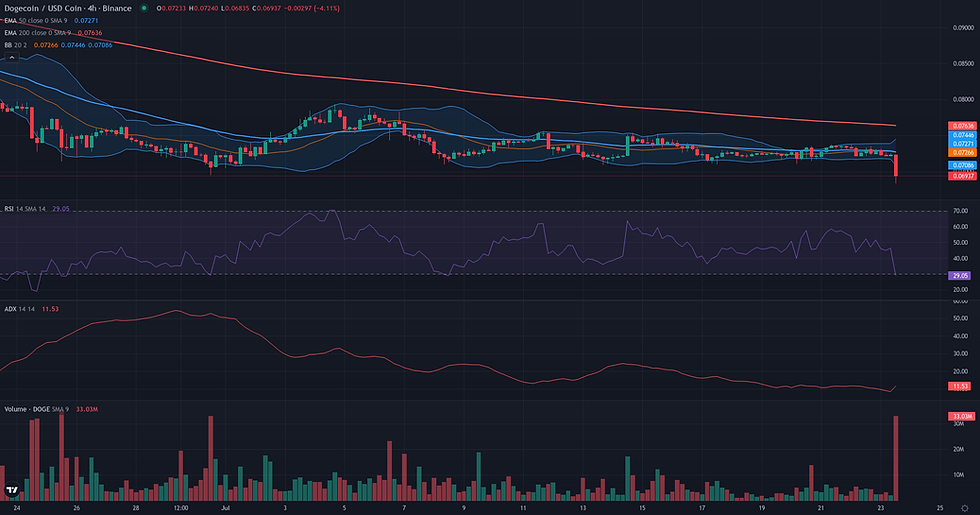
The market structure for DOGE/USDC presents a case of extreme compression, a condition often preceding a breakout, yet the framework is not deemed plausible at this time. For the past month, price has been locked in a tight range between 0.07 and 0.08, with volatility, as measured by the narrow Bollinger Bands, contracting significantly. This coiling of energy, however, lacks any discernible directional bias. The primary obstacle is the complete absence of bullish momentum. The D1 RSI stands at 41.42, well within bearish territory, and the D1 Volume Oscillator at -25.72% signals a profound lack of participant interest, which is contrary to the accumulation phase expected before an upward break. This weakness is compounded by the weekly context, which remains strongly bearish. Price is trading substantially below key weekly moving averages like the EMA50 and EMA200, both located at 0.12, making any potential upward move a difficult counter-trend effort. For the Breakout framework to become relevant, the structure would need to demonstrate a decisive close above the 0.08 resistance, supported by a clear resurgence in volume and a shift in momentum indicated by the RSI crossing above 50.

Continuation: Directional Flow Assessment
The technical structure for DOGE/USDC presents a plausible bearish continuation scenario, anchored in a clear multi-timeframe downtrend. On the weekly chart, the price has established a firm downward trajectory from the 0.12 area, and currently trades significantly below key long-term averages like the W1 EMA200 (0.12). The daily chart reveals that this bearish trend has entered a prolonged consolidation phase, with price action tightly contained between 0.07 support and 0.08 resistance for over a month. This type of range-bound activity following a strong directional move is often a pause before the trend resumes. Supporting this interpretation, the ADX on both D1 (32.70) and W1 (32.32) indicates that the underlying trend remains strong, while the negative D1 Volume Oscillator (-25.72) shows declining volume typical of a consolidation period. However, the reading is not without nuance. The D1 RSI at 41.42 is neutral, reflecting the current lack of directional pressure. Furthermore, the H1 timeframe shows deeply oversold conditions (RSI 23.02), which could precipitate a short-term bounce toward the 0.08 resistance before any potential breakdown. Despite these short-term factors, the dominant structural evidence supports the plausibility of a bearish continuation, contingent on a resolution below the 0.07 support.
Comparative Framework Verdict
Comparing the three strategic frameworks reveals a market at a distinct crossroads, with two plausible yet diametrically opposed scenarios emerging from the current consolidation. Both the Range/Rebound and the bearish Continuation frameworks are deemed plausible, while the bullish Breakout is considered not plausible. This leaves no single dominant framework, instead highlighting the critical tension at the current price level. The Range/Rebound scenario builds its case on the strength of the 0.07 support zone, which represents not just the month-long range floor but also a confluence of major weekly support levels. This framework anticipates that buying pressure will absorb the selling and initiate a move back toward the 0.08 resistance. Conversely, the Continuation framework posits that the current range is merely a pause within a larger, structurally bearish trend. It draws evidence from the fact that price remains well below all key daily and weekly moving averages, suggesting the path of least resistance is to the downside. The Breakout framework is dismissed due to a clear lack of supporting volume and momentum. The market's next directional move hinges entirely on the resolution of this range; a sustained D1 close below 0.07 would validate the continuation, whereas a push above 0.08 would give credence to the rebound.
For broader market context, readers can also review the latest related fundamental analysis for this pair.
For live market monitoring and the full interactive chart, readers can access the dedicated DOGE Market Hub.
Disclaimer
CopyTradia provides technical analysis for informational and educational purposes only. This content does not constitute financial advice, investment recommendations, or trading signals. Cryptocurrency markets are highly volatile. Past performance is not indicative of future results. Always conduct your own research (DYOR) and consult a qualified financial advisor before making any investment decisions.


