DOGE Range Rebound Analysis: $0.09 Resistance Test

This DOGE range rebound analysis examines the current DOGE/USDC structure in the context of support defense and weakening alternative frameworks. DOGE/USDC is currently navigating a pivotal technical juncture, testing significant resistance near the $0.09 level after a firm rebound from the $0.08 support area. The market structure is defined by a month-long consolidation, creating a well-established range that has contained price action. Daily momentum indicators reflect this tense equilibrium; the RSI at 56.22 suggests a slight bullish bias without being overextended, while an ADX reading of 31.26 indicates underlying directional energy that could fuel a move if a breakout occurs. This technical consolidation at a key resistance level follows a recent period of rising volatility and a significant spot price increase, as noted in the latest fundamental analysis, suggesting the market is now assessing its next directional move. The price is currently pinned between its 50-day EMA support ($0.08) and its 200-day EMA resistance ($0.09), setting the stage for the three distinct technical frameworks explored below.
DOGE Range Rebound Analysis: Support and Friction Zones
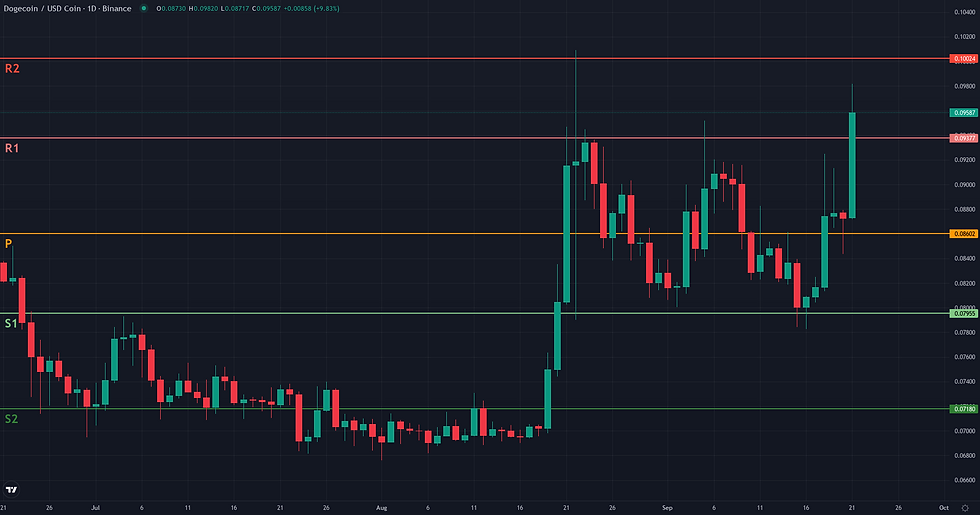
The Range/Rebound framework for DOGE/USDC is currently in a critical resolution phase. The analysis, which originated from the validation zone between 0.080 and 0.082 USDC, has seen its initial thesis play out as the price has effectively rebounded from the lower boundary of its established daily range. The market is now directly challenging the upper boundary of this consolidation channel. The primary point of friction is the dense resistance cluster located at 0.09 USDC. This level is not merely the top of the visible price range but is also technically reinforced by the D1 EMA 200 and the weekly pivot point (W1 P). The rebound's continuation hinges on its ability to overcome this significant obstacle. A failure here, marked by a rejection and a move back into the range, would weaken the framework's coherence. Conversely, a confirmation of the rebound's strength would be signaled by a decisive daily close above this 0.09 USDC ceiling. Such a resolution would suggest a breakout from the consolidation pattern and would shift the technical focus towards the next structural reference point. The first logical projection zone in this scenario lies at 0.10 USDC, which aligns with previous swing highs and the weekly R2 pivot. The framework would lose its validity if the market were to reverse its course entirely and break the support that initiated the rebound. A daily close below the 0.08 USDC floor, which is supported by the D1 EMA 50, would invalidate the range structure and suggest a potential resumption of the prior bearish trend.


Breakout: Structural Catalyst Assessment
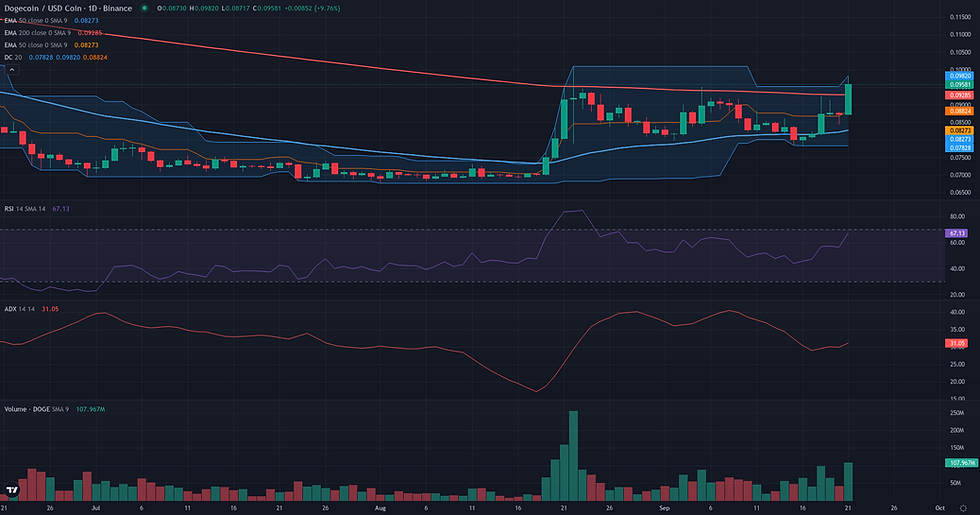
The Breakout framework for DOGE/USDC presents a borderline case, defined by a sharp contrast between a constructive daily setup and a restrictive weekly context. On the daily timeframe, the market has developed a textbook pre-breakout structure. For the past month, price has been coiling in a tight range, primarily between 0.08 and 0.09, causing the Bollinger Bands to contract significantly. This compression signals a period of low volatility and energy accumulation. The potential breakout level is clearly defined at 0.10, the upper band of the 20-day Donchian channel. Supporting this tactical picture, daily momentum indicators are favorable: the RSI at 56.22 is in bullish territory with room to expand, and the ADX at 31.26 suggests the market may be transitioning from consolidation to a new trend. However, this promising daily structure runs directly into a wall of weekly resistance. Both the 50-week and 200-week EMAs are clustered at 0.11, creating a formidable barrier just above the breakout level. Furthermore, the weekly RSI at 47.09 indicates a lack of broader bullish conviction. This conflict between the tactical opportunity on D1 and the strategic friction on W1 makes the framework borderline; a breakout attempt is structurally plausible, but its capacity for sustained follow-through is questionable.
Continuation: Directional Flow Assessment
The technical structure for DOGE/USDC presents a borderline case for a bullish continuation. The daily chart shows constructive price action, having established a base above the D1 EMA 50 (0.08) after a strong impulse in August. Momentum indicators support this view, with the D1 RSI holding above 50 (56.22) and the ADX at 31.26 confirming the presence of a directional trend. This suggests a potential continuation of the recovery. However, this nascent bullish structure faces significant headwinds that temper the outlook. The primary challenge is the confluence of resistance at the 0.09 level, which includes the D1 EMA 200 and the weekly pivot point. The price is currently testing this critical barrier. Furthermore, the weekly context remains broadly unfavorable, with the price trading significantly below its key weekly moving averages (W1 EMA 50 and 200 at 0.11), framing the current daily uptrend as a potential bounce within a larger bearish structure. The overbought H1 RSI (81.93) also hints at short-term exhaustion, adding another layer of caution. The framework's plausibility hinges on whether the price can achieve a decisive breakout above the 0.09 resistance zone; failure to do so would reinforce the dominance of the larger timeframe's bearish pressure.

Comparative Framework Verdict
Comparing the three strategic frameworks, the Range/Rebound scenario presents the most coherent and immediately applicable analysis of the current DOGE/USDC market structure. Rated as 'plausible', it accurately captures the clearly defined daily consolidation between $0.08 and $0.09. The framework's exit phase is active, with the price having successfully rebounded from the lower support boundary and now directly challenging the upper resistance at $0.09. This makes it the dominant technical reading for the week. In contrast, both the Breakout and Continuation frameworks are rated 'borderline'. Each identifies the constructive elements on the daily chart—such as momentum building and price coiling—but correctly flags the significant challenge posed by overhead resistance. The Breakout framework highlights the potential for a move towards $0.10 but is tempered by the formidable weekly moving average resistance at $0.11. Similarly, the Continuation framework notes the bullish daily trend but acknowledges it is stalled at the $0.09 resistance. Between the two, the Breakout framework offers a slightly more specific description of the price compression, making it the secondary scenario, while Continuation is the weakest due to its more generalized reading. The key level to monitor remains the $0.09 resistance cluster; a decisive close above it would lend credibility to the directional frameworks, whereas a rejection would reaffirm the range's dominance.
For broader market context, readers can also review the latest related fundamental analysis for this pair.
For live market monitoring and the full interactive chart, readers can access the dedicated DOGE Market Hub.
Disclaimer
CopyTradia provides technical analysis for informational and educational purposes only. This content does not constitute financial advice, investment recommendations, or trading signals. Cryptocurrency markets are highly volatile. Past performance is not indicative of future results. Always conduct your own research (DYOR) and consult a qualified financial advisor before making any investment decisions.


