DOGE Range Rebound Analysis: Consolidation Dominates

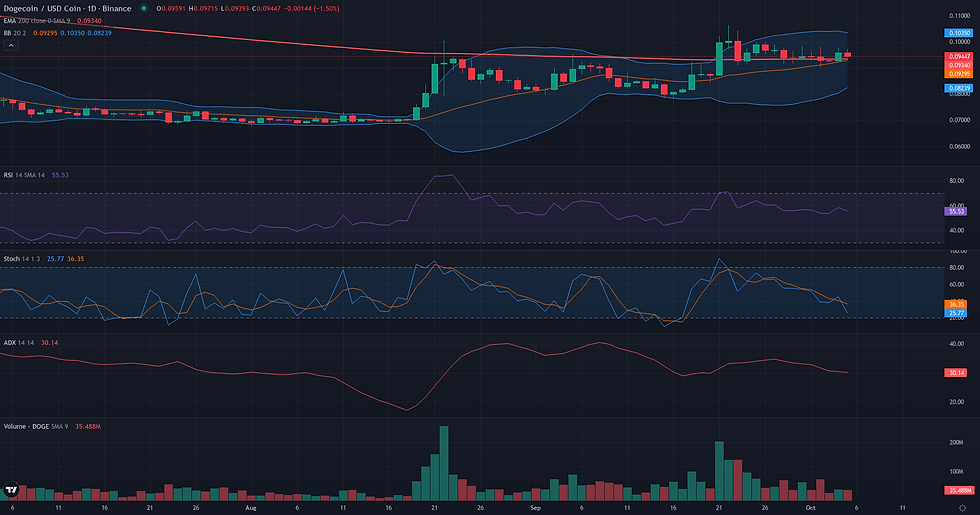
This DOGE range rebound analysis examines the current DOGE/USDC structure in the context of support defense and weakening alternative frameworks. DOGE/USDC is currently consolidating in a tight band around the 0.10 level, reflecting a market in equilibrium after a period of modest gains. The daily technical indicators paint a picture of constrained bullishness; the RSI at 58.38 shows positive momentum, while a firm ADX at 30.99 suggests underlying trend strength. However, this price action is caught between significant technical boundaries: key daily moving average support around 0.09 and a formidable weekly resistance cluster at 0.11. This technical stalemate aligns with the latest fundamental context for this pair, which highlights minimal recent spot price movement and a consolidating market structure. This sets the stage for a potential conflict between continued range-bound activity and a more decisive directional move, with the market currently lacking the conviction for the latter.

DOGE Range Rebound Analysis: Support and Friction Zones
The resolution for the DOGE/USDC Range/Rebound framework is contingent on the market's reaction to the pivotal validation zone between 0.08 and 0.09 USDC. This zone, anchored by key daily moving averages and weekly pivots, serves as the potential floor for a rebound. The framework's coherence would be lost if the price were to break this support decisively. A daily close below the 0.08 USDC level would constitute a structural breakdown of the daily range, thereby invalidating the entire rebound thesis. Assuming the validation zone holds, the path upward is not without obstacles. The first and most significant friction zone is located at 0.10 USDC. This level represents the upper boundary of the immediate trading range and is heavily fortified by a confluence of both daily (D1 R1/R2) and weekly (W1 R1/R2) pivot points. The current lack of directional momentum, evidenced by a low 4H ADX of 17.23, suggests this resistance will be formidable. If a rebound successfully materializes and overcomes the 0.10 USDC friction, the primary projection zone lies at 0.11 USDC. This area represents a macro-level resistance, defined by the convergence of the weekly EMA 50 and EMA 200. This level also marks the peak of the late September rally, making it a logical reference for a fully expressed rebound. Confirmation of the framework would involve a clear defense of the support zone followed by a breakout above 0.10, while a failure to hold the 0.09 pivot would serve as an early weakening signal.

Breakout: Structural Catalyst Assessment
The Breakout framework presents a borderline case for DOGE/USDC, characterized by a significant tension between a constructive daily chart pattern and weakening underlying dynamics. Structurally, the asset has formed a clear consolidation base around the 0.09 level, which is reinforced by both the D1 EMA50 and EMA200. Price is currently pressing against the 0.10 resistance, just below the key breakout candidate level of 0.11, the high of the last 20 days. This compression is supported by a strengthening daily trend (ADX at 30.99) and healthy momentum (RSI at 58.38), suggesting preparation for a potential upward move. However, two major factors temper this outlook. First, the volume has been declining during this consolidation phase, with the Volume Oscillator at a low -26.55, indicating a lack of strong conviction behind the recent price action. Second, the 0.11 breakout level is not an arbitrary point; it represents a formidable confluence of weekly resistance, aligning perfectly with both the W1 EMA50 and W1 EMA200. This creates a high-friction zone where a breakout attempt could easily fail. The framework is therefore borderline: the daily structure is readable and technically sound, but the lack of volume and the major weekly obstacle ahead make the probability of a sustained breakout uncertain.

Continuation: Directional Flow Assessment
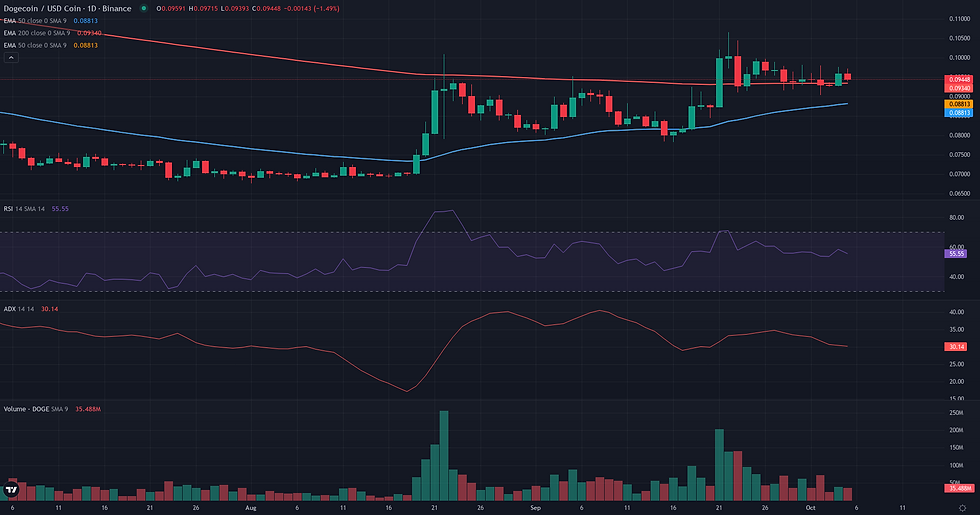
The technical structure for DOGE/USDC presents a conflicting scenario, rendering the Continuation framework borderline. On the one hand, the daily chart displays a constructive bullish posture. Price has established a base above the confluent D1 EMA 50 and EMA 200 at 0.09, and the trend strength indicator, ADX, is firm at 30.99, suggesting a directional market. This is complemented by a D1 RSI of 58.38, indicating positive momentum. On the other hand, this developing daily trend is running directly into a formidable wall of weekly resistance. The W1 EMA 50 and EMA 200 are both located at 0.11, creating a significant structural ceiling that could cap further upside. The current price action is a consolidation just below this zone, and the negative D1 Volume Oscillator (-26.55) points to a lack of decisive buying pressure during this pause. The loss of immediate momentum, visible in the H1 RSI dropping to 42.70, further underscores the hesitation at this critical juncture. The plausibility of a continuation therefore hinges on whether buyers can overcome this major weekly obstacle.
Comparative Framework Verdict
Comparing the three technical frameworks for DOGE/USDC reveals a clear hierarchy defined by the conflict between daily and weekly chart structures. The Range/Rebound framework emerges as the most coherent scenario, rated as plausible. Its strength lies in the well-defined daily trading range between approximately 0.08 and 0.10, which is nested within a broader multi-month consolidation. The framework identifies a robust support confluence around 0.08-0.09, providing a clear and logical basis for a potential rebound. In contrast, both the Breakout and Continuation frameworks are rated as borderline. While they correctly identify a constructive daily trend, with price holding above key moving averages, they both run into the same significant obstacle: a major weekly resistance zone at 0.11, formed by the W1 EMA 50 and EMA 200. This structural ceiling, combined with declining volume as indicated by the Volume Oscillator, significantly weakens the case for an imminent and sustained directional move. These two frameworks are therefore prospective but lack the confirmation and structural clarity of the range-bound scenario. Ultimately, the market's direction will likely be decided by its reaction to the immediate boundaries. A failure to break above the 0.10-0.11 resistance would reinforce the range thesis, while a decisive breach of this zone, supported by a surge in volume, would be required to validate either the Breakout or Continuation frameworks.
For broader market context, readers can also review the latest related fundamental analysis for this pair.
For live market monitoring and the full interactive chart, readers can access the dedicated DOGE Market Hub.
Disclaimer
CopyTradia provides technical analysis for informational and educational purposes only. This content does not constitute financial advice, investment recommendations, or trading signals. Cryptocurrency markets are highly volatile. Past performance is not indicative of future results. Always conduct your own research (DYOR) and consult a qualified financial advisor before making any investment decisions.


