DOGE Bearish Continuation Analysis: Consolidation at Lows

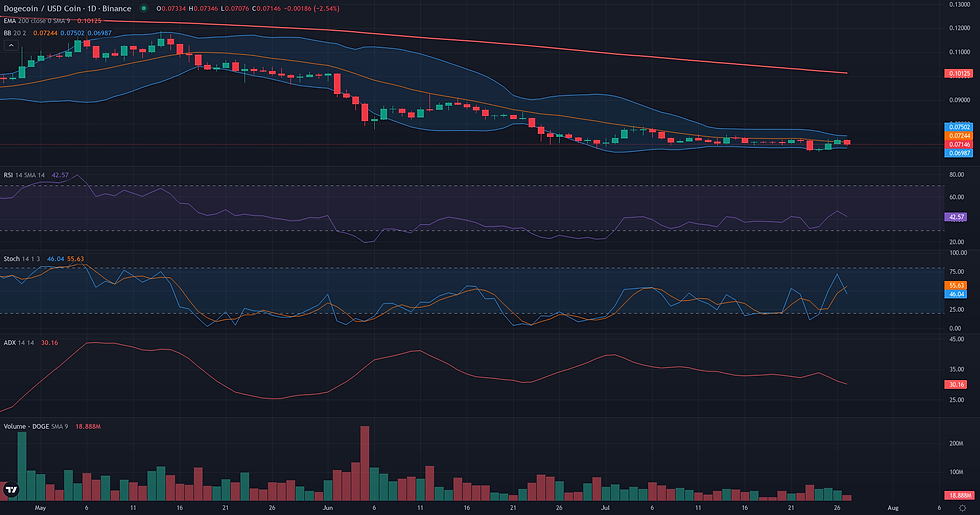
This DOGE bearish continuation analysis examines the current DOGE/USDC structure in the context of support defense and weakening alternative frameworks. DOGE/USDC is currently locked in a state of extreme technical compression, consolidating around the 0.07 level for over a month. This prolonged sideways movement is characterized by historically low volatility, as indicated by a D1 NATR of 3.85, and neutral daily momentum with the RSI at 47.55. The market's indecision reflects a broader structural conflict: a potential base forming at recent lows versus a dominant weekly downtrend, with the price remaining significantly below key long-term moving averages like the D1 EMA 200 at 0.10. This technical equilibrium aligns with the latest fundamental context, which describes a nuanced market undergoing a recalibration of leveraged exposure rather than a clear directional shift. The current price action suggests a market in a holding pattern, awaiting a catalyst to break the deadlock and resolve the prevailing directional uncertainty.

Range & Rebound Resolution: Support and Friction Zones
The Range/Rebound framework for DOGE/USDC hinges on the resilience of the 0.07 USDC support zone, a level defined by the W1 Lower Bollinger Band and multi-week lows. The current market structure is one of extreme consolidation, with price action on the 4H chart showing a complete flatline, signaling profound indecision. From this validation zone, the resolution pathways are distinctly binary. The invalidation of this framework would occur with a structural failure of the range floor. A daily close below 0.07 USDC would negate the rebound hypothesis, suggesting that the prolonged consolidation was a pause before a continuation of the broader downtrend. For a rebound to materialize, it must first overcome a significant friction zone at 0.08 USDC. This level acts as a technical ceiling, reinforced by a confluence of the D1 EMA 50, the W1 R1 and R2 pivots, and the top of the recent price range. A rejection from this area would weaken the framework's coherence. If the rebound successfully breaches this initial hurdle, technical projection zones come into view. The first reference point would be the area around 0.09 USDC, corresponding to the W1 Middle Bollinger Band. A more sustained move would look towards the D1 EMA 200 at 0.10 USDC as a major structural magnet. Confirmation of the rebound requires a clear breakout and daily close above 0.08 USDC, supported by expanding volume. Conversely, the framework weakens if the price remains stagnant at 0.07, as this inertia may signal absorption by sellers rather than accumulation by buyers, increasing the probability of a breakdown.

Breakout: Structural Catalyst Assessment
The technical structure for DOGE/USDC presents a borderline case for the Breakout framework, characterized by a significant conflict between the daily and weekly timeframes. On the daily chart, the conditions are texturally ideal for a potential breakout. Price has entered a phase of extreme compression, oscillating within a narrow channel for nearly a month, with volatility, measured by NATR at 3.85, reaching very low levels. This consolidation has formed a clear and well-defined resistance ceiling at the 0.08 mark, a level reinforced by the convergence of the 20-day Donchian upper, the upper Bollinger Band, and the 50-day EMA. However, this compelling daily setup is confronted by a strongly bearish weekly context. The potential breakout would be a counter-trend move against a dominant downtrend, with the price trading significantly below key weekly moving averages like the EMA 50 at 0.12. Furthermore, momentum indicators do not yet support a bullish resolution. The daily RSI is neutral at 47.55, indicating equilibrium rather than building pressure, while the weekly RSI remains weak at 33.99. This creates a tense equilibrium: while the daily structure is coiled for a potential release of energy, the overarching weekly trend acts as a powerful gravitational force, questioning the sustainability of any upward break.

DOGE Bearish Continuation Analysis: Directional Flow Assessment
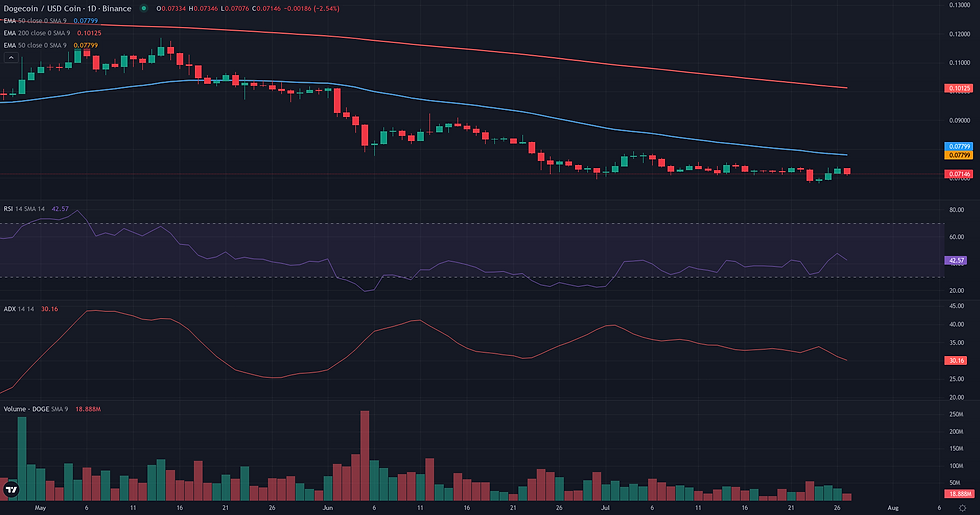
The technical structure for DOGE/USDC presents a plausible bearish continuation scenario, characterized by a stark contrast between a dominant weekly downtrend and a daily period of extreme consolidation. The weekly chart establishes a clear bearish context, with price trading at 0.07, far below key long-term averages like the W1 EMA 50 at 0.12. This macro pressure frames the daily price action, where the market has been locked in a tight range between 0.07 and 0.08 for over a month. This prolonged compression, confirmed by a low D1 NATR of 3.85%, is not a sign of strength but rather of market apathy at the lows. Critically, price remains subjugated below the D1 EMA 50 (0.08), which has acted as a ceiling for the entire consolidation period. While the daily RSI of 47.55 is neutral and reflects the current lack of directional activity, it does little to challenge the overarching structural weakness. The current price action is therefore interpreted as a pause or a potential distribution phase, which is more likely to resolve in the direction of the primary trend, suggesting a continuation to the downside.
Comparative Framework Verdict
Comparing the three technical frameworks reveals a clear hierarchy of plausibility dictated by the dominant weekly trend. The bearish Continuation framework emerges as the most coherent scenario. Rated as 'plausible', it interprets the prolonged consolidation at the 0.07 lows as a temporary pause within a well-established downtrend. This view is supported by the price remaining capped by the D1 EMA 50 at 0.08 and the prevailing weakness on the weekly chart, suggesting the path of least resistance is to the downside. Rated 'borderline', the Range/Rebound framework presents a viable but secondary scenario. Its strength lies in the significant structural support at the 0.07 level, a confluence of the weekly lower Bollinger Band and multi-week lows. However, its plausibility is undermined by a complete lack of bullish momentum, making any rebound speculative until confirmed by buying pressure. The bullish Breakout framework is also rated 'borderline' and is considered the weakest of the three. While it correctly identifies the classic price compression that often precedes a volatile move, it proposes a counter-trend resolution against a strong weekly downtrend without any supporting momentum indicators. For this framework to gain traction, a decisive break above the 0.08 resistance would be required, a move that currently lacks technical justification. The resolution of the current consolidation will likely depend on which force prevails: the static support at 0.07 or the dynamic pressure of the overarching downtrend.
For broader market context, readers can also review the latest related fundamental analysis for this pair.
For live market monitoring and the full interactive chart, readers can access the dedicated DOGE Market Hub.
Disclaimer
CopyTradia provides technical analysis for informational and educational purposes only. This content does not constitute financial advice, investment recommendations, or trading signals. Cryptocurrency markets are highly volatile. Past performance is not indicative of future results. Always conduct your own research (DYOR) and consult a qualified financial advisor before making any investment decisions.


