DOGE $0.11 Breakout Analysis: Price Coils Below Resistance

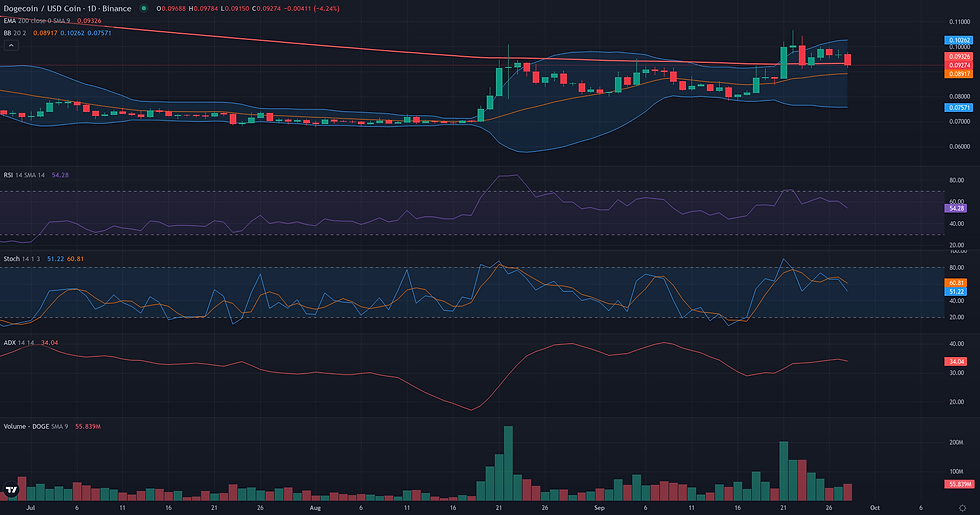
This DOGE $0.11 breakout analysis examines the current DOGE/USDC structure in the context of support defense and weakening alternative frameworks. DOGE/USDC is currently in a phase of tight consolidation around the $0.10 mark, following a significant upward impulse. The daily technical landscape is defined by a strong directional trend, evidenced by an ADX reading of 35.36, while the RSI at 60.50 indicates solid bullish momentum without being overextended. This price action has successfully established the daily moving averages around $0.09 as a new support floor. However, this bullish structure is now directly confronting a formidable resistance ceiling at $0.11, a level reinforced by long-term weekly moving averages. This technical tension aligns with the latest fundamental analysis, which highlights a period of elevated internal volatility as the market digests a month of prior gains. The current price compression below this key resistance sets the stage for the three potential scenarios analyzed below, each dependent on how the market resolves this critical structural conflict.

Range & Rebound: Market Structure Assessment
The Range/Rebound framework is assessed as not plausible for DOGE/USDC at this time. The core reason for this conclusion is a fundamental mismatch between the framework's requirements and the observed market dynamics. This framework seeks stabilization or a rebound from a support level within a defined range, but the current structure is characterized by a directional trend, as confirmed by a high D1 ADX of 35.36. Price has already executed a significant rebound from the 0.08-0.09 zone and is now pressing against a formidable weekly resistance ceiling at 0.11, a level reinforced by the W1 EMA 200. This positions the market for a potential breakout or rejection scenario, rather than a controlled consolidation. For the Range/Rebound framework to become relevant, the market would first need to demonstrate a clear loss of directional momentum, likely through a rejection from the 0.11 resistance followed by a successful and sustained defense of the 0.09 support level, thereby establishing the boundaries of a new, readable range.
DOGE $0.11 Breakout Analysis: Structural Catalyst Assessment
The Breakout framework appears plausible for DOGE/USDC, centered on a potential structural break above the 0.11 level. The daily chart presents a compelling technical picture of preparation. Following a strong impulse move that established a new local high at 0.11, the price has entered a tight consolidation phase around 0.10. This coiling of price action just below a major resistance is a classic characteristic of a pre-breakout structure. The dynamic is supported by a strengthening trend, confirmed by a D1 ADX reading of 35.36, and a bullish but not overextended D1 RSI at 60.50. Furthermore, the volume signature is particularly constructive: the initial ascent was powered by significant volume, while the current pause is occurring on decreasing volume, suggesting that energy is being accumulated rather than dissipated. The primary challenge to this scenario lies in the weight of the resistance itself. The 0.11 level is not merely a local peak; it represents a formidable confluence of weekly indicators, including the W1 EMA 50, W1 EMA 200, and the W1 R1 pivot. While this makes the level a significant hurdle, it also reinforces its importance, making a successful breach all the more structurally significant.

Continuation: Directional Flow Assessment
The technical structure for DOGE/USDC presents a compelling but contested case for a bullish continuation. On the daily timeframe, the setup is clearly constructive. A powerful upward impulse, initiated on September 21st with significant volume, has established a clear directional flow. This move has pushed the price above both the 50-day and 200-day EMAs, currently clustered at 0.09, which now act as a primary support floor. The subsequent price action has formed a tight consolidation around the 0.10 level on decreasing volume, a pattern often interpreted as a healthy pause before the next leg up. Momentum indicators support this view, with the D1 ADX at 35.36 confirming a trending environment and the D1 RSI at 60.50 showing strength without being overextended. However, this bullish daily narrative faces a critical test from the weekly chart. The current price consolidation is occurring directly beneath a formidable resistance zone at 0.11. This level represents a confluence of the 50-week and 200-week EMAs, as well as the weekly R1 pivot. This creates a classic conflict between a strong daily trend and significant long-term overhead supply. While the daily structure argues for continuation, the weekly context suggests a high probability of friction and potential rejection. The short-term H1 chart reflects this indecision, showing weak momentum. Therefore, while the underlying directional flow is positive, the immediate proximity to major resistance makes the continuation framework borderline, pending a decisive breakout above the 0.11 barrier.

Comparative Framework Verdict
Comparing the three technical frameworks reveals a clear hierarchy of plausibility, dictated by the conflict between the strong daily trend and major weekly resistance. The Breakout framework emerges as the most coherent scenario, rated as plausible. It directly addresses the current market structure: a clear consolidation of price just below the critical $0.11 resistance zone, supported by strong directional readings from the D1 ADX. This setup is a classic precursor to a potential directional expansion. Rated as borderline, the Continuation framework is the secondary scenario. While it correctly identifies the strong underlying daily trend, its plausibility is tempered by the immediate proximity of the heavy weekly resistance at $0.11, creating a significant structural hurdle. This conflict between daily bullishness and weekly overhead supply makes a smooth continuation less certain. Finally, the Range/Rebound framework is deemed not plausible. The market's trending nature, confirmed by high ADX values on both daily and weekly timeframes, is fundamentally incompatible with the stabilization required for a range-bound strategy. The key factor to watch will be the market's reaction at the $0.11 confluence, as a decisive break or a firm rejection will validate one directional framework over the others.
For broader market context, readers can also review the latest related fundamental analysis for this pair.
For live market monitoring and the full interactive chart, readers can access the dedicated DOGE Market Hub.
Disclaimer
CopyTradia provides technical analysis for informational and educational purposes only. This content does not constitute financial advice, investment recommendations, or trading signals. Cryptocurrency markets are highly volatile. Past performance is not indicative of future results. Always conduct your own research (DYOR) and consult a qualified financial advisor before making any investment decisions.


