Chainlink's Volatility Rises Amidst Price Appreciation

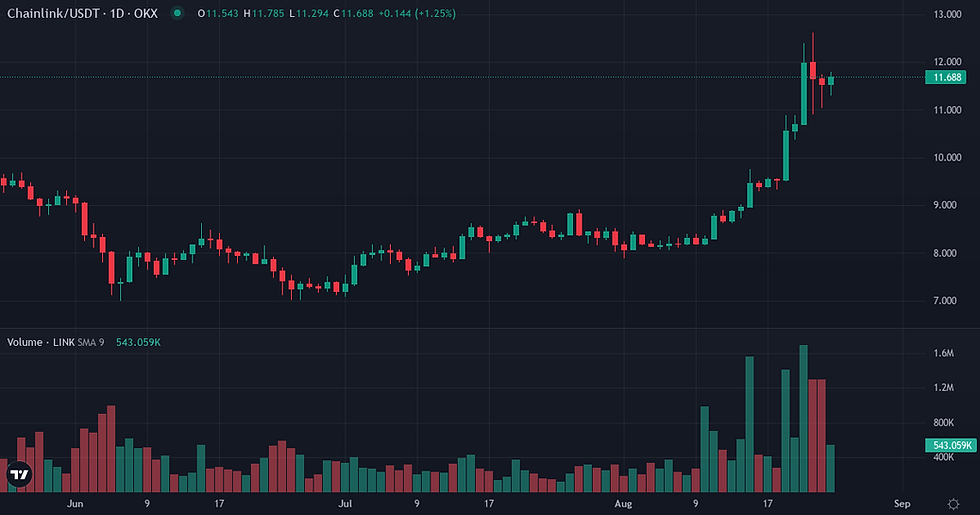
Chainlink has experienced a week of significant price appreciation, with its spot price advancing by over 21% in the past seven days. This upward movement has been accompanied by a notable increase in Chainlink's volatility, setting a dynamic backdrop for its market regime. The asset's market capitalization now stands at $8.758 billion, ranking 15th overall.
Market Regime and Volatility Metrics
The market regime for Chainlink this week was characterized by robust price momentum, with the asset gaining 21.70% over seven days and 38.60% over thirty days, reaching a spot price of $11.71. Despite this recent strength, LINK remains 77.78% below its all-time high. Realized volatility over the past seven days registered at 70.12%, notably above its 90-day baseline of 59.27%, indicating a recent acceleration in price swings. While the 30-day realized volatility was 52.95%, below its longer-term average, the short-term increase suggests a more active trading environment. Against Bitcoin, LINK showed a slight relative underperformance of -0.2344% over the past seven days, yet maintained a strong 30-day outperformance of +16.5289%. The 30-day correlation with Bitcoin stood at 0.7233, below its 90-day baseline of 0.8785, suggesting some decoupling from Bitcoin's movements. Volume momentum, measured by the 24-hour volume against the 7-day average, was 1.328, indicating higher recent trading activity.
Metric | Value |
LINK Price | $11.71 (+1.90% 24h / +21.70% 7d / +38.60% 30d) |
Volume 24h | $511.5M |
Native Quote Vol. 24h | $14.3M |
Market Cap | $8.76B |
Market Cap Rank | 15 |
Circulating Supply | 748.10M LINK |
ATH Distance | 77.78% below ATH |
Metric | Value |
LINK/BTC Ratio | 0.000149 |
Relative Perf. 7d vs BTC | -0.23% |
Relative Perf. 30d vs BTC | +16.53% |
Derivatives: Open Interest and Funding
Speculative positioning in Chainlink derivatives saw an expansion of exposure this week. Open Interest increased by 0.92% over seven days, reaching $0.122 billion, which is notably above its 90-day baseline of $0.077 billion. This indicates growing leveraged participation in the asset. Funding rates remained positive, with the current rate at 0.010000% and a 7-day cumulative rate of 0.049677%. The 30-day funding Z-score of 0.7998, significantly above the 30-day average of 0.007000%, suggests a sustained bullish bias among leveraged traders. Analysis of liquidations over the past seven days revealed a short-heavy profile, with short liquidations totaling $12.3 million (63.1%) compared to long liquidations of $7.2 million (36.9%). The 30-day average liquidation profile also shows a directional skew towards shorts, indicating that recent upward price movements have pressured bearish bets more intensely.

Metric | Value |
Funding Rate (current) | +0.0100% |
Funding Cumul. 7d | +0.0497% |
Open Interest | $0.12B (+0.92% 7d) |
Liq. 24h Longs | $0M |
Liq. 24h Shorts | $0M |
Liq. 7d Longs | $7M |
Liq. 7d Shorts | $12M |
Metric | Value |
Realized Vol 7d | +70.12% (90d avg: +59.27%) |
Realized Vol 30d | +52.95% |
Corr. BTC 30d | 0.7233 (90d avg: 0.8785) |
Beta vs BTC | 1.0120 |
Volume Momentum | 1.3280x |
Funding Z-Score 30d | 0.80σ |
Turnover Ratio | 0.0584 |
Liq. Intensity | 0.00222 |
Key Dynamics for the Week Ahead
Several dynamics warrant monitoring in the coming week. The persistence of elevated short-term volatility, with the 7-day realized volatility at 70.12% against a 90-day baseline of 59.27%, will be key to observing whether the current active trading environment consolidates or normalizes. The continued expansion of Open Interest above its 90-day baseline, coupled with positive funding rates, suggests sustained leveraged interest; any significant contraction in Open Interest or a shift in funding sentiment could signal a change in speculative conviction. Furthermore, the broader macro environment presents potential influences, with upcoming data releases including the Core PCE Price Index, Prelim GDP figures, and Unemployment Claims on August 26th and 27th. These events could introduce market-wide volatility, potentially impacting Chainlink's current correlation with Bitcoin and its relative performance.
Indicator | Value | Variation |
Broad Dollar Index | 118.90 | flat (7d) |
US 10Y Yield | 4.69% | -0.03pp (7d) |
Fed Balance Sheet | $6746B | -$14,256M (7d) |
M2 Money Supply | $23,155B | +$99.6B (1m) |
Fear & Greed | 73 (Greed) | +32 pts (7d) |
Fear & Greed Index: Alternative.me
Chainlink Weekly Takeaway
Chainlink concluded the week in a regime defined by strong price appreciation and an uptick in short-term volatility. The expansion of leveraged positioning, indicated by Open Interest above its baseline and positive funding rates, suggests a supportive speculative environment. However, the short-heavy liquidation profile points to underlying pressure on bearish positions, which has likely fueled some of the recent upward movement. While LINK has shown robust performance over the past month, its recent relative performance against Bitcoin has been more neutral, suggesting it is largely tracking the broader market while exhibiting autonomous volatility. The interplay between sustained leveraged interest, heightened volatility, and the broader market's reaction to upcoming economic data will be central to its trajectory.
Disclaimer
This article provides a fundamental analysis of Chainlink's market state and does not constitute investment advice or a recommendation to buy or sell any asset.


