Chainlink Uptrend Continuation: Analysis of LINK/USDC Market

This Chainlink uptrend continuation examines the current LINK/USDC structure in the context of support defense and weakening alternative frameworks. Chainlink (LINK/USDC) is currently consolidating within a strong uptrend, navigating a period of indecision after a significant pullback from its recent high of $15.77. The market's structure remains bullish, with the daily ADX at a high 40.73, confirming a powerful underlying trend. Momentum, as measured by the daily RSI at 60.37, is firm but not yet overextended, suggesting potential for further upside. This technical consolidation follows a period of fundamental rebalancing, as the latest Chainlink market dynamics analysis highlights a weekly pullback accompanied by shifts in volatility and speculative positioning. Price action is now caught between the recent weekly low of $13.16 and the peak resistance, creating a technical landscape where different strategic possibilities must be evaluated. The following analysis examines three distinct frameworks—Range/Rebound, Breakout, and Continuation—to map the current market structure.
Range & Rebound: Market Structure Assessment
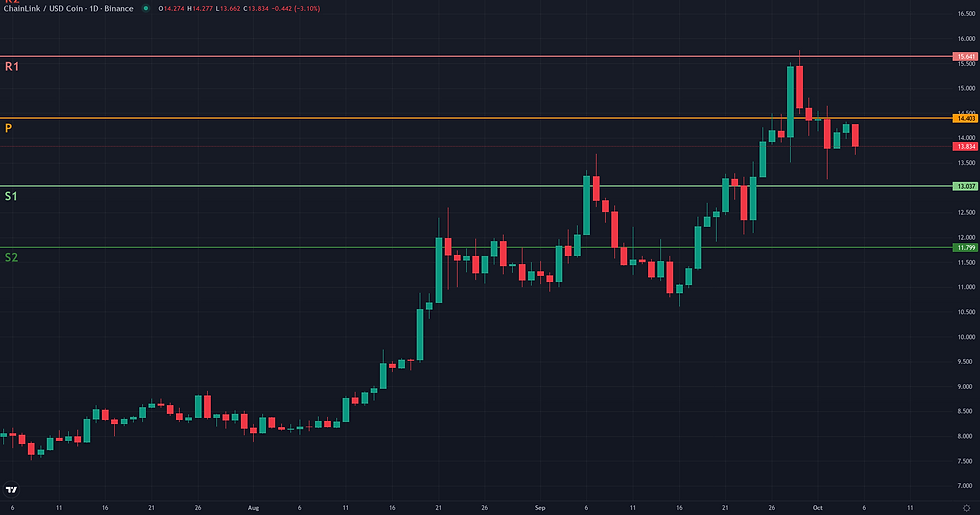
The Range/Rebound framework is evaluated as not plausible in the current market context for LINK/USDC. While the recent price action saw a notable pullback from a high of 15.77 to a low of 13.16, followed by a bounce, this behavior does not align with the core premises of a range-bound scenario. The bounce did occur from a technically significant confluence zone, anchored by the weekly S1 pivot at 13.04 and the long-term weekly 200-period EMA at 13.40. However, this event is more accurately interpreted as a test of support within a strong, established uptrend. The primary reason for rejecting the framework is the market's dominant character. The structure on both daily and weekly charts is unequivocally bullish, marked by a sequence of higher highs and higher lows. This trending nature is quantitatively confirmed by a high D1 ADX reading of 40.73, which indicates a powerful trend is in place. A range-bound condition, which this framework requires, is typically associated with an ADX below 25. The current market dynamic is one of trend continuation, not stabilization or reversal from a range low. For the Range/Rebound framework to become relevant, the market would first need to lose its directional momentum and establish a clear horizontal structure with defined support and resistance levels.

Breakout: Structural Catalyst Assessment
The Breakout framework for LINK/USDC presents a borderline case, characterized by a significant tension between a constructive long-term structure and evidence of strong resistance. On one hand, the market has established a clear resistance ceiling at 15.77, the peak of a recent powerful impulse. Price is currently consolidating below this level, a textbook preparation for a potential continuation. This bullish thesis is supported by a strong underlying trend, evidenced by a high ADX D1 reading of 40.73 and price holding firmly above key weekly moving averages. However, this optimistic reading is directly challenged by critical counter-signals. The attempt to break higher was met with a decisive rejection, leaving a long upper wick on the last weekly candle — a classic sign of seller dominance at that price zone. Furthermore, the current consolidation is occurring on weakening volume, with the Volume Oscillator D1 at -27.80%, suggesting a potential lack of conviction from buyers. This conflict between the bullish trend context and the bearish rejection at the key level makes the breakout scenario technically readable but highly contested, warranting a 'borderline' plausibility verdict.
Chainlink Uptrend Continuation: Directional Flow Assessment
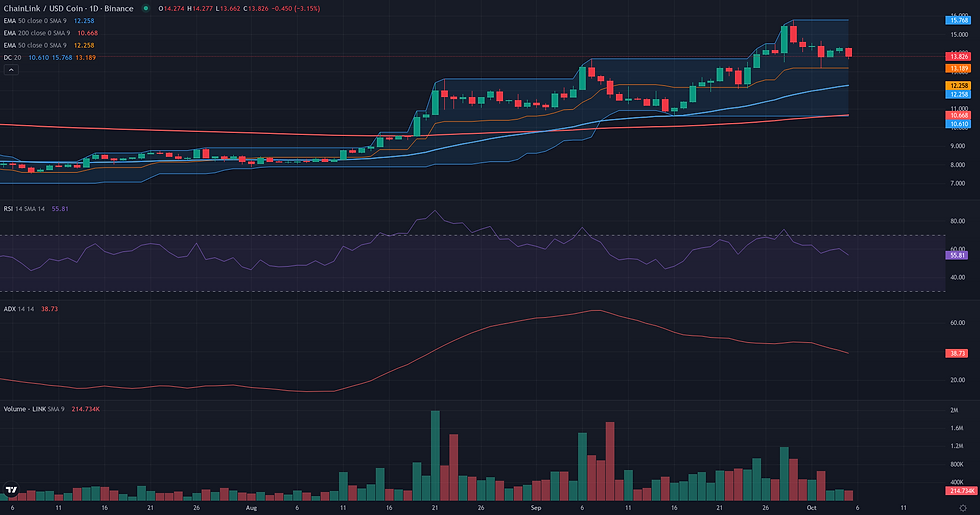
The continuation framework appears technically plausible for LINK/USDC, supported by a coherent bullish structure across daily and weekly timeframes. The price is in a clear uptrend, maintaining its position significantly above the D1 EMA50 (12.17), with the trend's strength underscored by a high D1 ADX reading of 40.73. The recent price action is best characterized as a pullback from the 15.77 high, a common feature in a healthy trend. This retracement is currently testing a significant confluence of support between 13.04 and 13.40, a zone defined by the weekly S1 pivot and the weekly EMA200. A successful defense of this area would reinforce the bullish structure, treating former resistance as new support. However, some caution is warranted. The most recent weekly candle shows indecision at the highs, and the H1 micro-chart indicates a sharp increase in selling pressure in the very short term. These factors suggest the pullback may not have fully resolved, but they do not yet invalidate the dominant bullish structure that underpins the continuation thesis.

Comparative Framework Verdict
In the current market structure for LINK/USDC, the three analytical frameworks present a clear hierarchy of plausibility. The Continuation framework emerges as the most coherent scenario, rated as 'plausible'. It aligns with the dominant bullish trend observed on both daily and weekly charts, interpreting the recent retracement from $15.77 not as a reversal, but as a constructive pullback. This view is supported by price holding above a key confluence of support between $13.04 and $13.40, which includes the weekly 200-period EMA. The Breakout framework is considered 'borderline'. While it correctly identifies the critical resistance at $15.77, its immediate plausibility is weakened by significant counter-signals. The sharp rejection at this level, evidenced by a long upper wick on the last weekly candle, combined with low volume on the consolidation, suggests a lack of buyer conviction for an imminent upward thrust. Finally, the Range/Rebound framework is deemed 'not plausible'. The market's strong trending character, confirmed by a high ADX, directly contradicts the core requirement of a sideways, range-bound environment. The key determinant for the near future will be whether the support zone holds, validating the continuation thesis, or if buying pressure can overcome the recent rejection at resistance.
For broader market context, readers can also review the latest related fundamental analysis for this pair.
For live market monitoring and the full interactive chart, readers can access the dedicated LINK Market Hub.
Disclaimer
CopyTradia provides technical analysis for informational and educational purposes only. This content does not constitute financial advice, investment recommendations, or trading signals. Cryptocurrency markets are highly volatile. Past performance is not indicative of future results. Always conduct your own research (DYOR) and consult a qualified financial advisor before making any investment decisions.


