Chainlink Range Rebound Analysis: Rebound Stalls at Resistance

This Chainlink range rebound analysis examines the current LINK/USDC structure in the context of support defense and weakening alternative frameworks. LINK/USDC is currently navigating a complex technical landscape, consolidating around 12.36 after a strong upward impulse was met with significant resistance. The daily chart reveals a market with powerful underlying momentum, confirmed by a very high ADX reading of 48.50, which indicates a strong, established trend. Despite this, the daily RSI at 56.29 suggests that while momentum is bullish, it is not yet in overbought territory, leaving room for further movement. The price action for the week has been contained between a low of 10.61 and a high of 12.69, defining the immediate structural boundaries. This high-volatility technical environment aligns with recent market analysis indicating increased leveraged participation and expanding derivatives interest, suggesting the current consolidation is a pause within an active market rather than a return to passivity. The key question for the week ahead is whether the prevailing trend can overcome the formidable resistance that recently halted its advance.
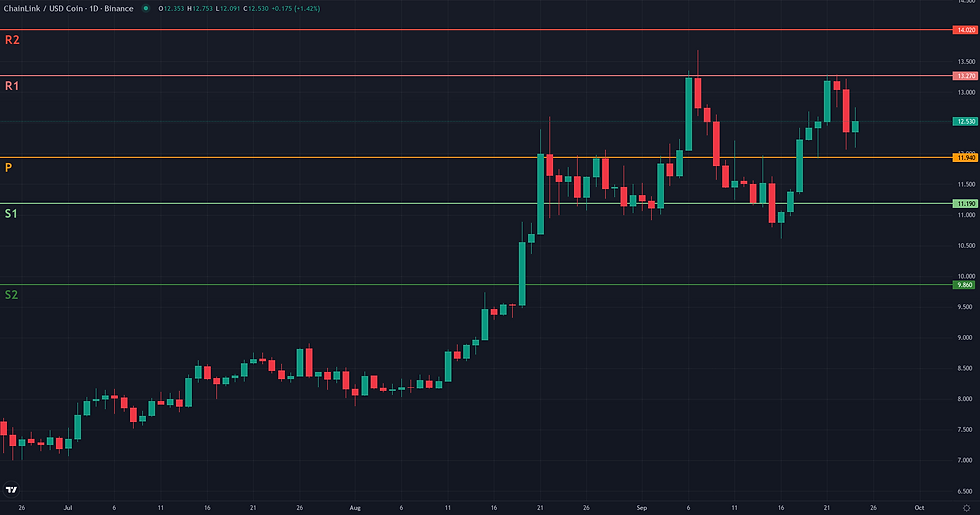
Chainlink Range Rebound Analysis: Support and Friction Zones
The Range/Rebound framework for LINK/USDC, validated by holding above the 12.03 USDC D1 middle Bollinger Band, now faces a critical resolution test. The rebound from the 10.61 USDC low has stalled, meeting significant resistance that defines the potential upper boundary of the range and creates clear conditions for the framework's success or failure. The invalidation zone for this rebound scenario is a daily close below the 11.94 USDC weekly pivot point. Such a move would break the immediate upward structure and signal that sellers have regained control, negating the stabilization premise. Before any further upside, the framework must overcome two key friction zones. The first is the immediate D1 pivot at 12.54 USDC, where the price is currently facing rejection. The more significant obstacle is the dense resistance cluster between 13.27 USDC (Weekly R1) and 13.39 USDC (W1 EMA 200). This area, which includes the recent 13.29 USDC high, has already proven to be a powerful barrier. If the rebound can gather momentum and clear this major resistance, technical projection zones come into view at the prior D1 high of 13.69 USDC and, further, the Weekly R2 pivot at 14.02 USDC. Confirmation of the framework's strength would require a decisive daily close above this 13.27-13.39 USDC resistance. Conversely, the framework is showing signs of weakening, with a neutral 4H RSI (48.06) and negative volume oscillator. A failure to hold the 12.03 USDC validation level on a 4H basis would be a strong warning that the rebound is losing coherence.

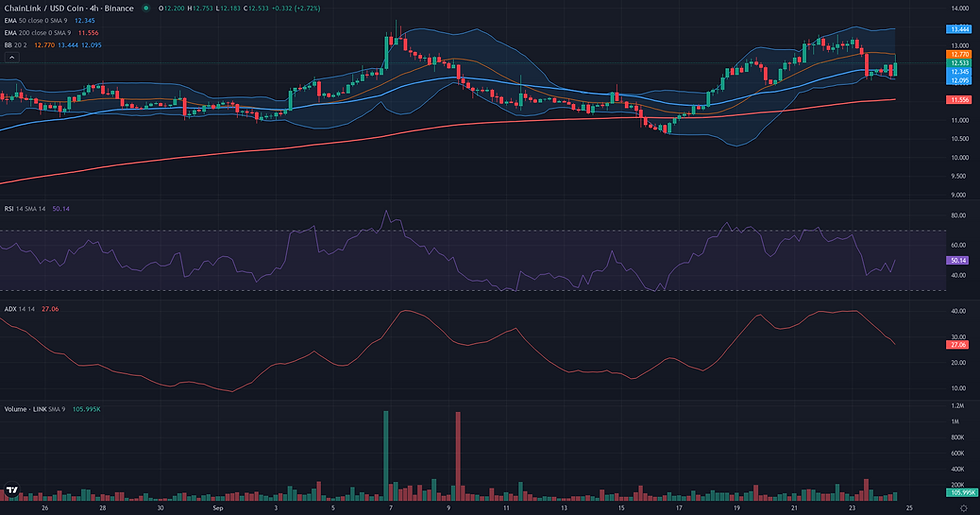
Breakout: Structural Catalyst Assessment
The Breakout framework for LINK/USDC is currently assessed as borderline due to a significant tension between strong daily trend dynamics and a formidable multi-layered resistance zone. On one hand, the case for a potential breakout is supported by a powerful daily trend, evidenced by a high ADX reading of 48.50, and healthy momentum, with the D1 RSI at 56.29 suggesting further upside capacity. The price structure remains above key supports like the D1 EMA 50. However, this bullish momentum is directly confronting a major structural ceiling located between 13.27 and 13.69. This area is not a simple price high; it is reinforced by the W1 R1 pivot and, most critically, the W1 EMA 200 at 13.39. The most recent daily price action, a sharp rejection from this very zone, underscores the strength of sellers at this level and prevents a more confident 'plausible' reading. The current market structure is therefore a standoff, where a breakout is technically conceivable but heavily contested.

Continuation: Directional Flow Assessment
The continuation framework for LINK/USDC is currently assessed as borderline due to a significant tension between a strong daily uptrend and a major weekly resistance. The daily structure exhibits clear bullish characteristics: price is holding comfortably above its 50-day EMA (11.03) and the trend's strength is confirmed by a very high ADX reading of 48.50. This suggests a powerful underlying momentum. However, this momentum recently collided with the 200-week EMA at 13.39, a formidable long-term resistance level. The resulting rejection was sharp, culminating in a significant bearish daily candle on September 23rd. This event interrupts the 'stable directional flow' sought by the continuation framework, introducing uncertainty. While the pullback has found initial support above the weekly pivot of 11.94, the market must now prove its ability to absorb this selling pressure. The current structure is therefore at a crossroads, testing the resilience of the uptrend against a well-defined macro resistance.
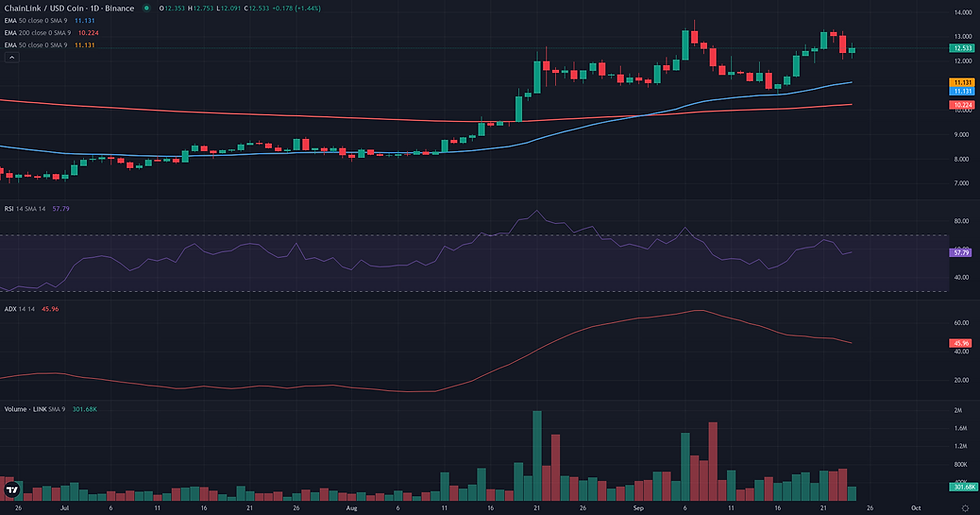
Comparative Framework Verdict
In assessing the three strategic frameworks for LINK/USDC, a clear hierarchy emerges from the current technical structure. The Range/Rebound framework is deemed plausible, while both the Breakout and Continuation frameworks are rated as borderline. The Range/Rebound scenario is the most coherent interpretation of recent price action. It accurately captures the strong rebound from a well-defined support floor around 10.61 USDC and the subsequent stabilization above the 12.03 USDC D1 middle Bollinger Band. This framework effectively models the market as a consolidation phase where price oscillates between established support and the significant resistance that recently capped the rally. Conversely, the Breakout and Continuation frameworks share the same critical vulnerability. While both correctly identify the powerful underlying daily trend, evidenced by a high ADX, they are currently neutralized by a formidable resistance cluster between 13.27 and 13.69 USDC, which is reinforced by the major W1 EMA 200. The recent sharp rejection from this zone undermines the premise of a smooth continuation or an imminent breakout, making these scenarios speculative until that barrier is overcome. The market is therefore at an inflection point, caught between strong trend dynamics pushing upwards and a major structural ceiling pressing down. The resolution will likely depend on whether the price can defend its rebound structure above the ~11.94 support or gather enough momentum to decisively break the overhead resistance.
For broader market context, readers can also review the latest related fundamental analysis for this pair.
For live market monitoring and the full interactive chart, readers can access the dedicated LINK Market Hub.
Disclaimer
CopyTradia provides technical analysis for informational and educational purposes only. This content does not constitute financial advice, investment recommendations, or trading signals. Cryptocurrency markets are highly volatile. Past performance is not indicative of future results. Always conduct your own research (DYOR) and consult a qualified financial advisor before making any investment decisions.


