Chainlink Range Rebound Analysis: Borderline Scenario Emerges

This Chainlink range rebound analysis examines the current LINK/USDC structure in the context of support defense and weakening alternative frameworks. LINK/USDC is currently navigating a period of technical weakness, having closed the daily session at 12.03. The price is situated below key moving averages, including the D1 EMA 50 (12.42) and the critical W1 EMA 200 (13.41), signaling a challenging overhead resistance structure. Momentum on the daily timeframe is bearish, with the RSI at 40.78, though the ADX at 27.10 suggests the underlying downtrend still has some directional strength. The recent price action has pushed LINK towards its weekly low of 11.52, testing a significant support zone. This technical picture of a market testing support under bearish pressure aligns with the broader context of 'Chainlink positioning tension' amid declining volatility, as noted in the latest fundamental analysis. This creates a complex environment where the potential for a short-term bounce conflicts with the prevailing corrective trend, setting the stage for the distinct technical frameworks analyzed below.
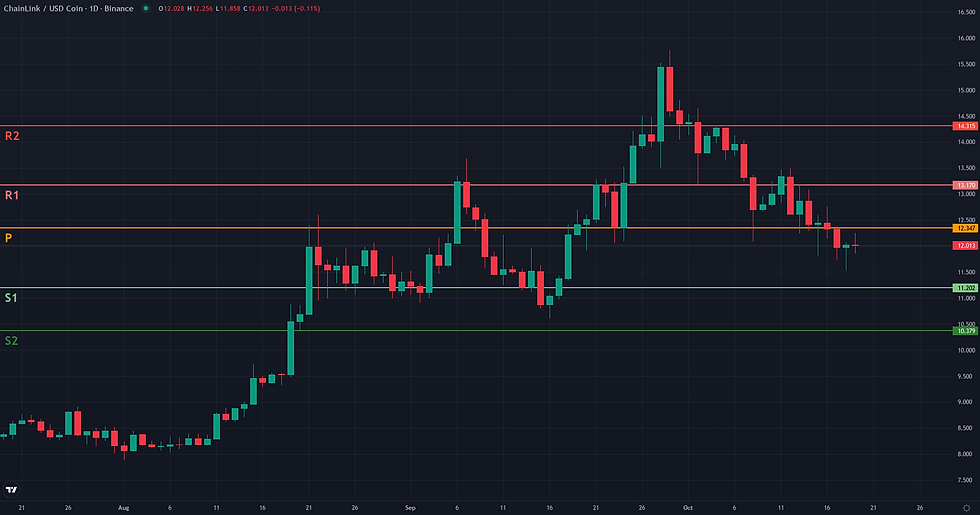
Chainlink Range Rebound Analysis: Support and Friction Zones
The resolution path for this borderline Range/Rebound framework for LINK/USDC is defined by a series of critical technical hurdles. Starting from the validation zone—a required D1 close above 12.84—the framework's coherence depends on overcoming significant overhead resistance while defending a key support floor. The invalidation of this rebound scenario is clearly marked by a daily close below the recent low of 11.52. This level's importance is magnified by its confluence with the weekly EMA 50 at 11.50, creating a critical support cluster. A break below this zone would suggest the downtrend is resuming, negating the rebound thesis. For the rebound to confirm, its path is layered with friction. The first test is the immediate resistance area around the D1 EMA 50 at 12.42. Should buyers push through, they must then achieve the validation condition by closing above 12.84. Even then, the most significant challenge lies ahead: a dense structural resistance zone between the W1 R1 pivot at 13.17 and the W1 EMA 200 at 13.41. This latter level is particularly important, as trading below it currently defines the broader bearish context. A successful and sustained move above 13.41 would serve as strong confirmation, shifting the market structure. In such a scenario, the primary technical projection is the W1 R2 pivot at 14.31. A more extended move could target the prior structural high near 15.77, which would frame the upper boundary of a potential new trading range. Conversely, a rejection from any of these resistance levels would weaken the framework, signaling that buying pressure is insufficient to reverse the trend.


Breakout: Structural Catalyst Assessment
The Breakout framework is currently not plausible for LINK/USDC. The market structure does not exhibit the necessary preparation for a structural break to the upside. Instead of consolidating beneath a key resistance, the price is in a clear corrective downtrend after peaking at 15.77. This downward trajectory is confirmed by price action trading below significant moving averages, including the daily EMA 50 (12.42) and, more critically, the weekly EMA 200 (13.41), which often acts as a long-term bull/bear delimiter. Momentum indicators reinforce this view, with the daily RSI at a weak 40.78 and a negative Volume Oscillator (-24.74) suggesting a lack of buying pressure. For this framework to become relevant, the market would first need to halt its descent and establish a clear consolidation base, followed by a sustained move to re-challenge the resistance levels with expanding volume and momentum.

Continuation: Directional Flow Assessment
The Continuation framework is assessed as not plausible at this time. While the broader weekly context shows a significant uptrend from the lows earlier in the year, the current daily structure is in direct opposition to a continuation scenario. Since peaking at 15.77 in late September, the price has entered a clear corrective downtrend, characterized by a consistent series of lower highs and lower lows. This bearish structure is reinforced by the price's position below key dynamic levels, notably the D1 EMA50 at 12.42 and, more significantly, the W1 EMA200 at 13.41. Momentum indicators confirm this loss of upward drive, with the D1 RSI at 40.78, firmly in bearish territory. The 'Stable Directional Flow' signature required by this framework is absent. For a continuation to become plausible again, the market would first need to invalidate the current D1 downtrend by reclaiming key resistance levels and re-establishing a pattern of higher lows and higher highs.

Comparative Framework Verdict
In this week's LINK technical analysis, the three strategic frameworks present a clear hierarchy of plausibility, though none achieve a high degree of confidence. The Range/Rebound scenario is the most relevant, rated as borderline. It captures the immediate market tension, where tactical D1 signals—such as oversold Stochastics and a bullish doji pattern at the 11.52 support level—suggest potential for a bounce. However, its plausibility is capped by the broader strategic weakness, defined by the price trading below the critical W1 EMA 200 at 13.41, which now acts as significant overhead resistance. Conversely, both the Breakout and Continuation frameworks are assessed as not plausible. The market's current structure, a clear corrective downtrend from the recent 15.77 peak, directly contradicts the conditions required for either a bullish continuation or an upside breakout. The price is moving away from resistance, not compressing below it, and lacks the necessary upward momentum. Therefore, the market's immediate path appears to hinge on the resolution of the Range/Rebound scenario. For this framework to gain credibility, buyers must defend the 11.50-11.52 support floor and achieve a daily close above the 12.84 validation level. Failure to do so would invalidate the rebound thesis and likely signal a resumption of the prevailing downtrend.
For broader market context, readers can also review the latest related fundamental analysis for this pair.
For live market monitoring and the full interactive chart, readers can access the dedicated LINK Market Hub.
Disclaimer
CopyTradia provides technical analysis for informational and educational purposes only. This content does not constitute financial advice, investment recommendations, or trading signals. Cryptocurrency markets are highly volatile. Past performance is not indicative of future results. Always conduct your own research (DYOR) and consult a qualified financial advisor before making any investment decisions.


