Chainlink Range Rebound Analysis: Price Tests Key Resistance

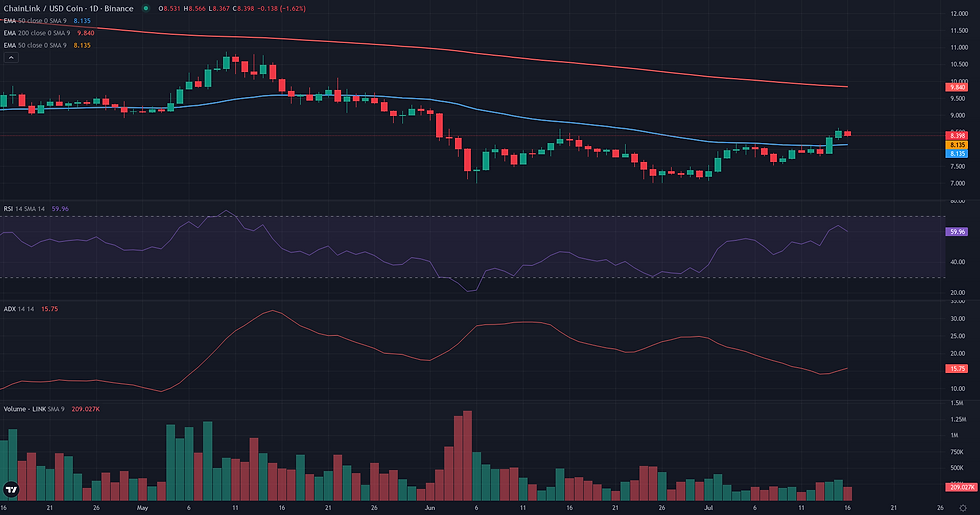
This Chainlink range rebound analysis examines the current LINK/USDC structure in the context of support defense and weakening alternative frameworks. LINK/USDC has shown notable short-term strength, rebounding from a significant support base around 7.00 USDC to a recent daily close of 8.54. This upward move is supported by positive daily momentum, with the RSI D1 at 63.80, and has pushed the price above its 50-day moving average. However, this bullish impulse is occurring within a non-trending market structure, confirmed by a very low D1 ADX of 15.00, which suggests consolidation rather than the start of a new, powerful trend. This technical configuration, marked by a compression of price action, aligns with recent fundamental analysis describing a market navigating a narrow range with underlying tensions between stable price action and shifts in speculative positioning. The market is therefore caught between immediate buying pressure and a broader, bearish context defined by its position well below the long-term 200-day EMA at 10.18, creating a complex and indecisive environment.
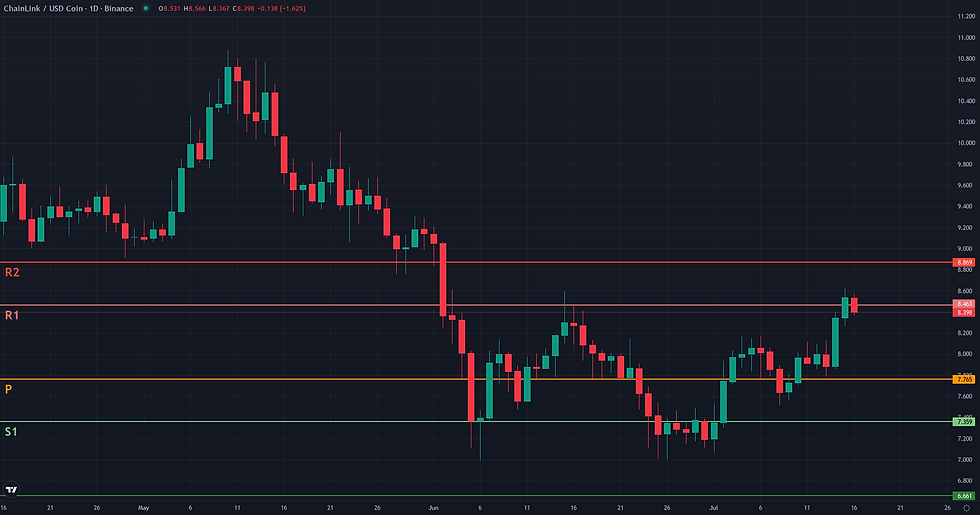
Chainlink Range Rebound Analysis: Support and Friction Zones
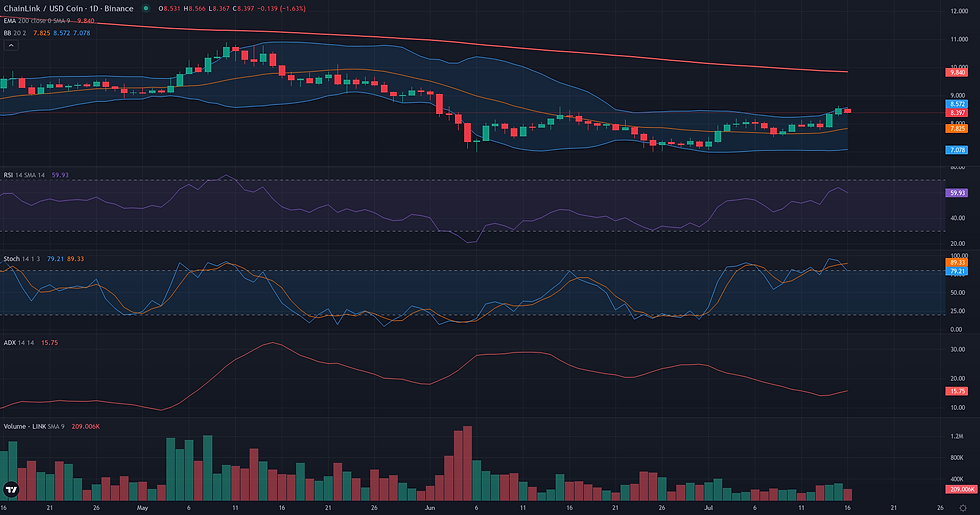
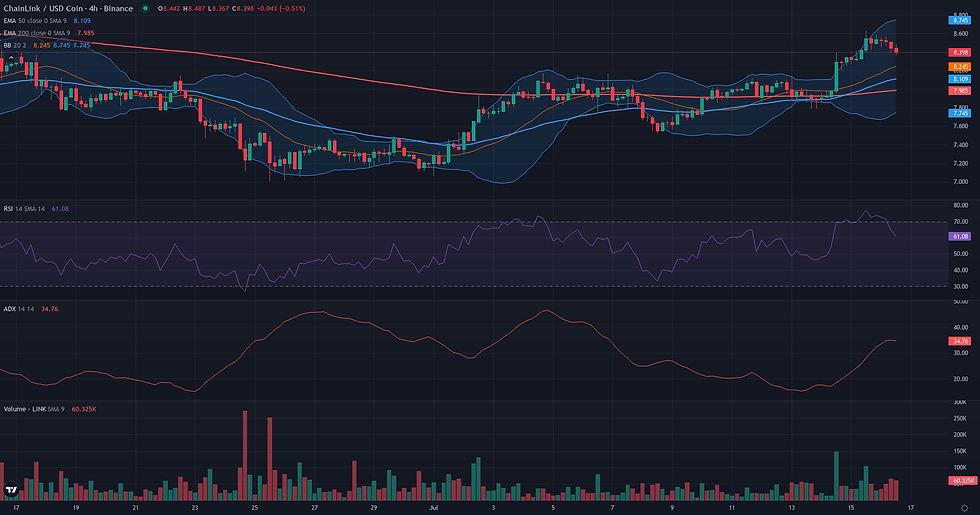
Following the plausible Range/Rebound framework identified, the resolution analysis focuses on the price action evolving from the validation zone of 7.77 - 7.96 USDC. This zone, anchored by the D1 Bollinger middle band and 4H EMA 200, represents the critical mid-range support. The framework would lose its coherence if the price were to suffer a sustained D1 breakdown below this area, particularly below the W1 Pivot at 7.77. Such a move would invalidate the rebound thesis and signal a likely return towards the major structural support and range low around 7.00. Currently, the price is challenging the upper boundary of its consolidation range, encountering immediate friction. The primary obstacle is the resistance cluster between 8.46 (W1 R1) and 8.69 (D1 R1), which encompasses the recent highs. This zone is the decisive battleground for buyers. A failure to overcome this barrier would be a weakening signal, suggesting buyer exhaustion and a potential rotation back down towards the validation zone. The next level of friction above the range is located at the W1 R2 pivot of 8.87. For the rebound to confirm its trajectory, a clear and decisive D1 close above the 8.69 resistance is required. A successful breakout would open the path to higher technical projections. The first logical reference point would be the 9.00 - 9.15 area, a zone of prior structural relevance. A more significant, longer-term projection lies at the D1 EMA 200, currently situated at 10.18, which represents a major macro resistance.
Breakout: Structural Catalyst Assessment
The Breakout framework for LINK/USDC presents a borderline case, characterized by a direct conflict between immediate price action and underlying market dynamics. On one hand, the structure is constructive: price has pushed to test the 20-day high at 8.63, closing above both its upper Bollinger Band (8.50) and the weekly R1 pivot (8.46). This price behavior against a clearly defined resistance is the primary element supporting a breakout reading. However, this bullish pressure lacks critical confirmation. The D1 ADX, at a low 15.00, indicates a non-trending environment, while the negative Volume Oscillator (-4.34) reveals that the recent ascent was not backed by strong participation. This suggests the move may lack the energy required for a sustained structural break. Compounding this weakness is a bearish weekly context, where the price remains far below key moving averages like the W1 EMA 50 at 11.68. This tension between a promising D1 price pattern and its unsupportive volume, momentum, and higher-timeframe context makes the breakout scenario technically fragile and thus warrants a borderline classification.
Continuation: Directional Flow Assessment
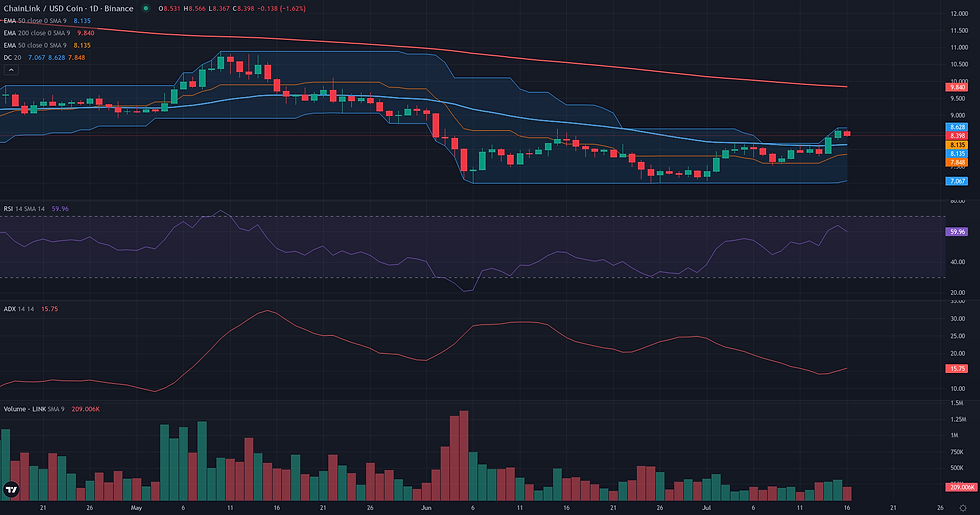
The technical structure for LINK/USDC presents a borderline case for a bullish continuation. On the daily timeframe, a constructive reversal pattern has emerged from the 7.00 low set in late June, characterized by a sequence of higher highs and higher lows. This move has pushed the price above its D1 EMA50 at 8.12, with a supportive D1 RSI of 63.80 indicating positive momentum. However, this short-term bullish narrative is challenged by two significant factors. Firstly, the D1 ADX reading is exceptionally low at 15.00, signaling that the current rally lacks strong directional conviction and may not be sustainable. Secondly, the weekly context remains firmly bearish, with price trading substantially below key long-term moving averages like the W1 EMA50 (11.68). This frames the current daily rally as a counter-trend move within a dominant downtrend. Price is now testing a resistance zone defined by the W1 R1 pivot at 8.46 and the recent high of 8.63. The tension between the nascent D1 uptrend and the powerful W1 downtrend makes the continuation framework plausible but highly conditional.
Comparative Framework Verdict
Comparing the three technical frameworks, the Range/Rebound scenario emerges as the most plausible. This view is strongly supported by the market's clear consolidation structure, anchored by a robust support level at 7.00 and confirmed by a D1 ADX of 15.00, which signals a distinct lack of directional trend. The current price action is best interpreted as a rebound from the range low, now testing the resistance at the top of this structure. For this framework to remain valid, the price must continue to hold above the critical mid-range support identified between 7.77 and 7.96. In contrast, both the Breakout and Continuation frameworks are rated as borderline. While they correctly identify the current bullish momentum on the daily chart, they are undermined by significant weaknesses. The rally lacks strong volume confirmation, and the overarching weekly trend remains bearish, framing this move as a potential counter-trend rally rather than a sustainable reversal. The Breakout framework is contingent on a decisive push above the range highs around 8.63, an event that currently lacks the necessary underlying trend strength to be considered highly probable. Looking ahead, the market's resolution around the immediate resistance zone of 8.46 - 8.69 will be critical. A rejection from this area would reinforce the dominance of the Range/Rebound framework, while a sustained break above it, accompanied by a rise in volume and ADX, would lend new credibility to the borderline Breakout scenario.
For broader market context, readers can also review the latest related fundamental analysis for this pair.
For live market monitoring and the full interactive chart, readers can access the dedicated LINK Market Hub.
Disclaimer
CopyTradia provides technical analysis for informational and educational purposes only. This content does not constitute financial advice, investment recommendations, or trading signals. Cryptocurrency markets are highly volatile. Past performance is not indicative of future results. Always conduct your own research (DYOR) and consult a qualified financial advisor before making any investment decisions.


