Chainlink Price Analysis: Bullish Structure, Weak Momentum

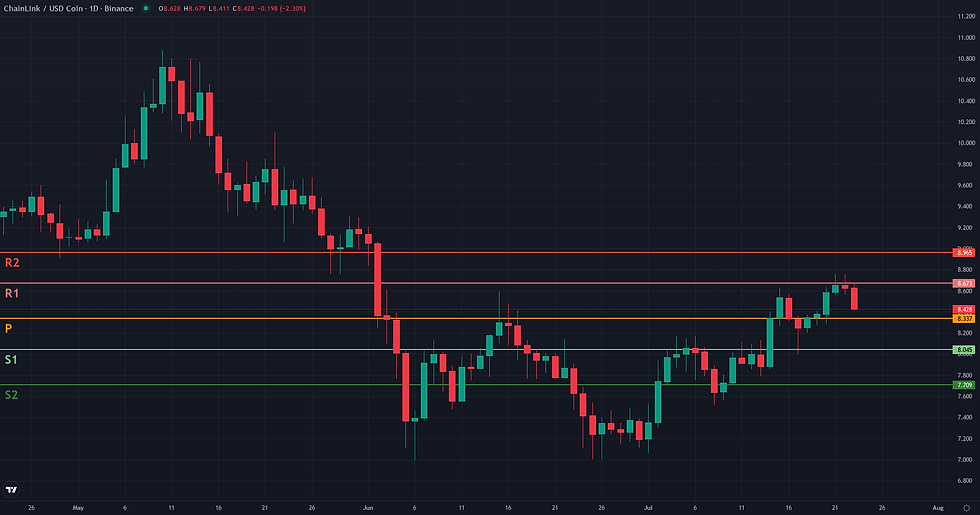
This Chainlink price analysis examines the current LINK/USDC structure in the context of support defense and weakening alternative frameworks. LINK/USDC is currently navigating a critical juncture, consolidating near the $8.63 level after a gradual recovery from its late-June lows. The daily chart shows price holding above its 50-day moving average, a constructive sign, but it remains significantly below the key 200-day average at $9.94. This price action creates a picture of indecision, which is strongly reflected in the underlying indicators. While the daily RSI at 63.08 suggests bullish momentum has room to continue, the ADX reading of just 15.90 signals a distinct lack of trend strength, indicating the rally is proceeding with very low conviction. This technical indecision follows a period of relative outperformance, where Chainlink showed strength against the wider market amidst a slowly improving, but still fearful, sentiment. The current structure suggests the market is pausing to determine if this recent strength can translate into a sustainable trend or if it will falter against overhead resistance.
Chainlink Price Analysis: Technical Framework Assessment
The Range/Rebound framework is assessed as not plausible in the current market context. The core premise of this framework—identifying a stabilization or rebound from a support level or range low—is not met by the present price action. Instead of consolidating at a potential bottom, the daily chart shows a gradual price recovery from the 7.00 low established in late June. This recovery has evolved into a weak, low-conviction uptrend, evidenced by a very low D1 ADX of 15.90. This move is now directly challenging significant weekly resistance, notably the W1 Bollinger Middle Band at 8.74. The broader weekly context remains structurally bearish (W1 ADX at 31.52, W1 RSI at 41.98), framing the current daily ascent as a counter-trend rally. Furthermore, daily momentum indicators like the Stochastic (91.70) are in overbought territory, suggesting the move may be losing steam rather than initiating a new leg up. For this framework to become relevant, a structural change would be required, such as a rejection from resistance followed by the formation of a clear consolidation base at a lower support level.

Breakout: Structural Catalyst Assessment
The technical structure for LINK/USDC presents a conflicting and borderline scenario for a breakout framework. On one hand, the daily price action is constructive, forming a tight consolidation range over the past several sessions directly beneath a well-defined horizontal resistance at 8.76, which aligns with the 20-day Donchian channel upper band. This type of compression is often the prelude to a sharp directional move. The daily RSI, at 63.08, supports this with a healthy bullish momentum that is not yet overextended. However, this bullish structure is severely undermined by a lack of underlying energy. The D1 ADX reading of 15.90 is critically low, indicating a distinct absence of trend strength required to fuel a sustained breakout. This is further corroborated by a negative Volume Oscillator (-11.65%), suggesting the recent ascent towards resistance has occurred on weakening volume. Compounding these concerns is the bearish weekly context, where the price remains significantly below key long-term moving averages like the D1 EMA200 (9.94) and W1 EMA50 (11.41). Therefore, while the price pattern is visually appealing for a breakout, the lack of confirmation from momentum and volume indicators, combined with significant higher-timeframe headwinds, renders the setup highly ambiguous and places it in the borderline category.

Continuation: Directional Flow Assessment
The technical structure for LINK/USDC presents a complex case for a bullish continuation, leading to a 'borderline' plausibility verdict. On one hand, the daily chart displays a constructive short-term uptrend initiated in late June, characterized by a sequence of higher highs and higher lows. Price is currently holding above its D1 EMA 50 (8.21), and the D1 RSI at 63.08 reflects healthy momentum. However, this local bullishness is met with significant friction. The primary concern is the D1 ADX, which at 15.90 signals a very weak, non-directional market, directly challenging the premise of a 'Stable Directional Flow'. This lack of confirmed trend strength is compounded by the broader weekly context, where the current rally appears as a counter-trend move within a dominant bearish structure, with price trading far below key weekly moving averages. The current price action is stalled near a resistance cluster around the recent high of 8.76 and the weekly R1 pivot of 8.67, suggesting indecision. For the continuation framework to become more plausible, the market would need to demonstrate renewed directional conviction, notably through a break above this resistance and a corresponding rise in the ADX.

Comparative Framework Verdict
A comparative analysis of the three technical frameworks reveals a market at a crossroads, with no single scenario presenting a high-conviction case. The Range/Rebound framework is assessed as 'not plausible' as its core condition is unmet; the price is currently challenging resistance near recent highs, not stabilizing at a support level. This makes it the weakest and least relevant of the three scenarios. Both the Breakout and Continuation frameworks are rated as 'borderline', and they highlight the same central conflict in the current market structure. They both acknowledge the constructive daily price pattern, where LINK/USDC has formed a tight consolidation just below the key horizontal resistance at $8.76. However, both frameworks are severely undermined by a critical lack of supporting evidence. The daily ADX is extremely low at 15.90, indicating a non-trending environment, while a negative Volume Oscillator points to diminishing conviction behind the recent price rise. Furthermore, the broader weekly context remains bearish, acting as a headwind against any short-term bullish thesis. As a result, neither framework is dominant. The market appears poised for a potential move, but the lack of underlying momentum makes the entire structure fragile and ambiguous.
For broader market context, readers can also review the latest related fundamental analysis for this pair.
For live market monitoring and the full interactive chart, readers can access the dedicated LINK Market Hub.
Disclaimer
CopyTradia provides technical analysis for informational and educational purposes only. This content does not constitute financial advice, investment recommendations, or trading signals. Cryptocurrency markets are highly volatile. Past performance is not indicative of future results. Always conduct your own research (DYOR) and consult a qualified financial advisor before making any investment decisions.


