Chainlink Positioning Drives Weekly Outperformance

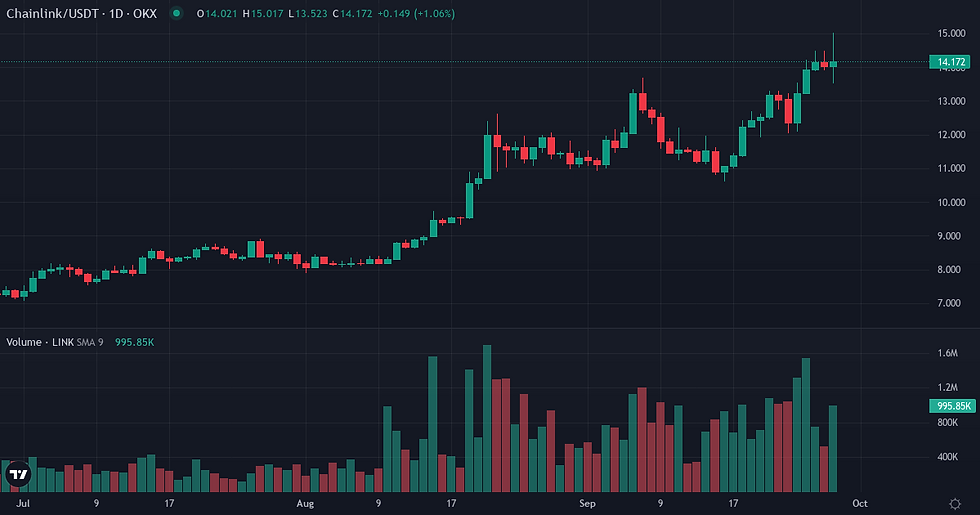
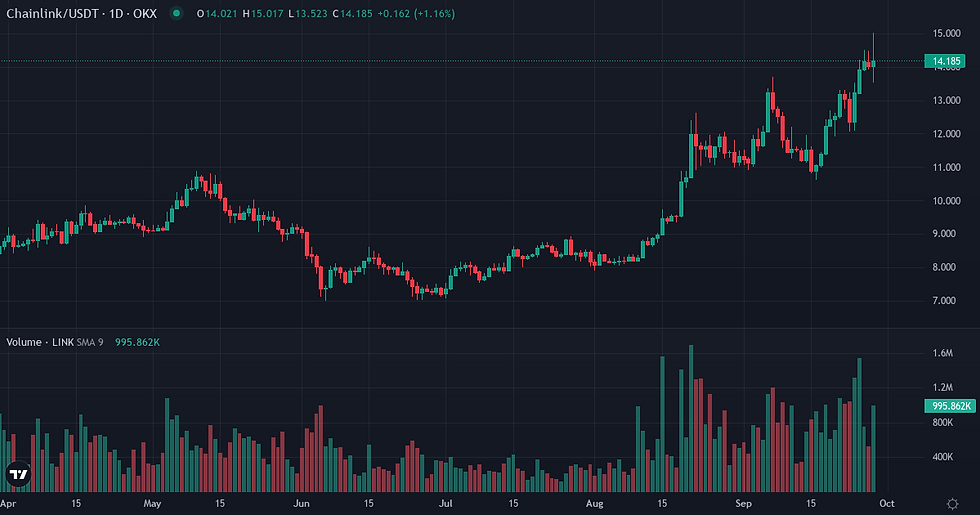
Chainlink concluded the week at $14.19, demonstrating significant upward momentum with a 12.65% gain over seven days and a 30.55% increase over the past month. This performance was accompanied by elevated volatility and a notable expansion in leveraged interest. The asset also exhibited strong relative strength against Bitcoin, suggesting an autonomous impulse within the broader market context, even as overall market sentiment, as measured by the Fear & Greed Index, showed a slight deterioration from extreme greed.
Chainlink Price Action and Volatility
Chainlink's price action this week was defined by a strong upward trend, closing at $14.19. This represented a 12.65% increase over the past seven days and a 30.55% gain over the last month. The 7-day realized volatility stood at 92.83%, significantly above its 90-day baseline of 59.78%, indicating an intensified price discovery phase. Against Bitcoin, Chainlink demonstrated robust outperformance, gaining 9.655% over the past week and 14.1588% over the last 30 days, with its BTC ratio increasing from 0.000153 to 0.000167. The 30-day correlation to BTC was 0.6261, below its 90-day baseline of 0.7288, suggesting a degree of independent movement. Despite recent gains, LINK remains 73.07% below its all-time high.
Metric | Value |
LINK Price | $14.19 (+0.97% 24h / +12.65% 7d / +30.55% 30d) |
Volume 24h | $841.3M |
Native Quote Vol. 24h | $7.8M |
Market Cap | $10.61B |
Market Cap Rank | 13 |
Circulating Supply | 748.10M LINK |
ATH Distance | 73.07% below ATH |
Metric | Value |
LINK/BTC Ratio | 0.000167 |
Relative Perf. 7d vs BTC | +9.65% |
Relative Perf. 30d vs BTC | +14.16% |
Derivatives Market and Chainlink Positioning
Speculative interest in Chainlink expanded notably, with Open Interest increasing by 14.05% over the past seven days to $0.140B, surpassing its 90-day baseline of $0.095B. This indicates a growing leveraged participation in the asset's upward trajectory. The funding rate remained positive at 0.010000%, with its 30-day Z-score at 1.0870, reflecting sustained positive sentiment among derivatives traders. Over the past seven days, total liquidations amounted to $15.68M, with long liquidations accounting for 58.5% ($9.2M) and short liquidations for 41.5% ($6.5M). The 30-day average liquidation profile indicates a balanced directional skew, suggesting that despite the recent increase in long liquidations, the market has not developed an extreme imbalance in positioning.
Metric | Value |
Funding Rate (current) | +0.0100% |
Funding Cumul. 7d | +0.0433% |
Open Interest | $0.14B (+14.05% 7d) |
Liq. 24h Longs | $1M |
Liq. 24h Shorts | $1M |
Liq. 7d Longs | $9M |
Liq. 7d Shorts | $7M |
Metric | Value |
Realized Vol 7d | +92.83% (90d avg: +59.78%) |
Realized Vol 30d | +73.58% |
Corr. BTC 30d | 0.6261 (90d avg: 0.7288) |
Beta vs BTC | 1.1620 |
Volume Momentum | 0.5586x |
Funding Z-Score 30d | 1.09σ |
Turnover Ratio | 0.0793 |
Liq. Intensity | 0.00148 |
Key Monitoring Points for LINK
Monitoring conditions for the upcoming week include assessing whether Chainlink maintains its current trajectory of outperformance against Bitcoin, especially if its 30-day correlation to BTC continues to diverge from its longer-term baseline, which would confirm autonomous strength. Observing the derivatives market for signs of overheating or consolidation will be crucial; a continued expansion of Open Interest without a significant acceleration in the funding rate or a shift towards an imbalanced liquidation profile would suggest more sustainable leveraged interest. Furthermore, the interaction with the upcoming macroeconomic calendar, featuring critical data points such as the ADP Non-Farm Employment Change, Core PCE Price Index, and the broader Non-Farm Employment Change, could introduce market-wide volatility that might test LINK's internal resilience.
Indicator | Value | Variation |
Broad Dollar Index | 119.51 | flat (7d) |
US 10Y Yield | 5.18% | +0.22pp (7d) |
Fed Balance Sheet | $6748B | +$1,156M (7d) |
M2 Money Supply | $23,343B | +$124.9B (1m) |
Fear & Greed | 74 (Greed) | -4 pts (7d) |
Fear & Greed Index: Alternative.me
Chainlink Weekly Takeaway
Chainlink closed the week in a regime of pronounced internal strength, characterized by significant price appreciation and consistent outperformance against Bitcoin. This upward movement is reinforced by expanding leveraged interest, as evidenced by rising Open Interest and elevated funding rates. While volatility has increased, the derivatives market's liquidation profile suggests that speculative positioning, though active, has not yet reached an extreme imbalance. The asset is demonstrating a degree of independence from broader market movements, attracting capital and sustaining its rally.
Disclaimer
This article provides a fundamental analysis of Chainlink based on available market data and should not be construed as investment advice or a recommendation to buy or sell any asset.


