BNB Weekly Range Rebound: Validating Support at EMA 200

This BNB weekly range rebound examines the current BNB/USDC structure in the context of support defense and weakening alternative frameworks. BNB/USDC is currently navigating a critical inflection point, consolidating at a major long-term support level defined by the weekly EMA 200 around $570. The daily chart reflects a state of equilibrium, with a neutral RSI of 48.90 and a recent D1 close at $571.42, indicating a pause in directional momentum. However, this apparent calm is underpinned by a notable lack of trend on the higher timeframe, evidenced by a very low weekly ADX of 15.39. This technical consolidation aligns with recent fundamental analysis highlighting a period of compressed volatility and a neutral speculative landscape, setting the stage for a potential directional move. While the market structure has been range-bound for several weeks, a recent bullish impulse from support suggests a potential shift in dynamics, challenging the upper boundaries of the established consolidation zone.

BNB Weekly Range Rebound: Support and Friction Zones
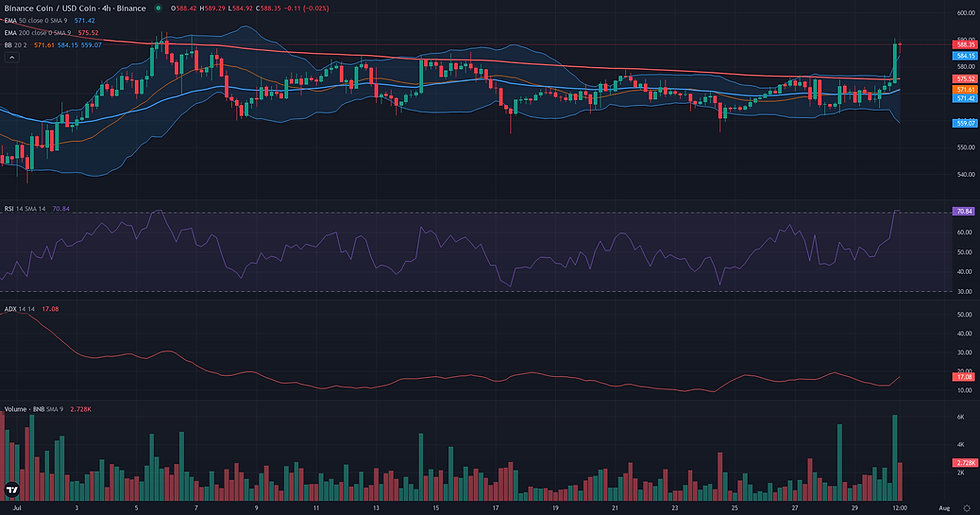
The Range/Rebound framework for BNB/USDC, anchored in the 555.00 - 563.00 validation zone, has seen a powerful initial resolution. The market has reacted strongly from the W1 EMA 200 support level (569.66), with a significant bullish impulse on the 4H timeframe pushing the price well above key short-term resistance levels, including the D1 EMA 50 (581.60). This aggressive move provides initial validation for the rebound scenario. The structural integrity of this framework now hinges on defending its origin point. The invalidation zone is defined by a definitive failure of this support structure. A daily close below 555.00, which marks the recent weekly lows, would negate the rebound thesis and suggest a continuation of the prior downtrend. As the price moves upward, it faces several technical obstacles. The first friction zone is located around the W1 R2 pivot at 593.80, which aligns with recent daily highs. Should this level be overcome, a more substantial resistance cluster awaits in the 600.00 - 617.00 area, a region of significant price congestion from mid-June. If the rebound successfully navigates these friction zones, the primary long-term projection reference is the D1 EMA 200, currently situated at 671.70. Confirmation of the rebound's strength would involve the price establishing a new support base above the recently broken D1 EMA 50 (581.60). Conversely, a sharp rejection from the current levels and a close back below this moving average would serve as a weakening condition, indicating the bullish impulse may have been exhaustive.

Breakout: Structural Catalyst Assessment
The Breakout framework for BNB/USDC presents a borderline case, characterized by a significant tension between a constructive daily price structure and a lack of convincing momentum. On the daily chart, the market has formed a clear consolidation range over the past month, establishing a well-defined resistance ceiling around 585.48, a level marked by the 20-day Donchian Channel upper. This type of price compression is often the precursor to a directional expansion. However, the indicators typically associated with building pressure are currently silent. The D1 RSI hovers at a neutral 48.90, and the Volume Oscillator's negative reading of -6.20 suggests a distinct absence of accumulation. The situation is further complicated by the weekly context. Price is currently pivoting on the critical W1 EMA 200 at 569.66, a major long-term support level. While holding this level is a prerequisite for any bullish scenario, the weak W1 RSI of 40.52 signals that the broader trend lacks strength. This places the market at a precarious crossroads, making the breakout hypothesis technically present but lacking the necessary confirmation to be considered fully plausible.

Continuation: Directional Flow Assessment
The Continuation framework is currently not plausible for BNB/USDC as the market structure lacks the required 'Stable Directional Flow'. Price action on the daily timeframe is confined within a multi-week consolidation range, oscillating between support around 555.57 and resistance near 593.05. This sideways movement directly contradicts the premise of an existing trend to be continued. The weekly context reinforces this reading of indecision, with the ADX indicator at a very low 15.39, signaling a distinct lack of directional strength. Furthermore, the daily price is currently positioned below its EMA 50 (581.60), a key area of dynamic resistance, while the RSI (48.90) remains neutral. Although recent H1 price action shows a bullish impulse, it is not sufficient to override the dominant range-bound structure. For the Continuation framework to become relevant, a clear and sustained breakout from this consolidation range would be necessary, accompanied by a rise in directional momentum indicators.

Comparative Framework Verdict
In assessing the three technical frameworks for BNB/USDC, the Range/Rebound scenario emerges as the most plausible. Its premise, centered on a consolidation at the critical weekly EMA 200 support, has been strongly validated by a recent and powerful bullish impulse from this zone. This price action confirms the relevance of the 555.00 - 563.00 support area and gives immediate coherence to the rebound thesis. The Breakout framework is considered borderline and secondary. While it correctly identified the key resistance area around $585 that needed to be overcome, its initial assessment was tempered by a lack of momentum and volume. The recent sharp move upwards now brings this scenario into sharper focus, effectively acting as the successful resolution of the range's upper boundary. Its plausibility has increased as a consequence of the rebound's initial success. Conversely, the Continuation framework is deemed not plausible. The market structure is unequivocally one of consolidation, confirmed by a low weekly ADX and range-bound price action on the daily chart. There is no pre-existing directional trend to continue. Looking ahead, the key element to monitor will be whether the price can establish a new support base above the recently broken D1 EMA 50 ($581.60) to confirm the start of a new directional phase.
For broader market context, readers can also review the latest related fundamental analysis for this pair.
For live market monitoring and the full interactive chart, readers can access the dedicated BNB Market Hub.
Disclaimer
CopyTradia provides technical analysis for informational and educational purposes only. This content does not constitute financial advice, investment recommendations, or trading signals. Cryptocurrency markets are highly volatile. Past performance is not indicative of future results. Always conduct your own research (DYOR) and consult a qualified financial advisor before making any investment decisions.


