BNB Range Rebound Analysis: Consolidation Deepens

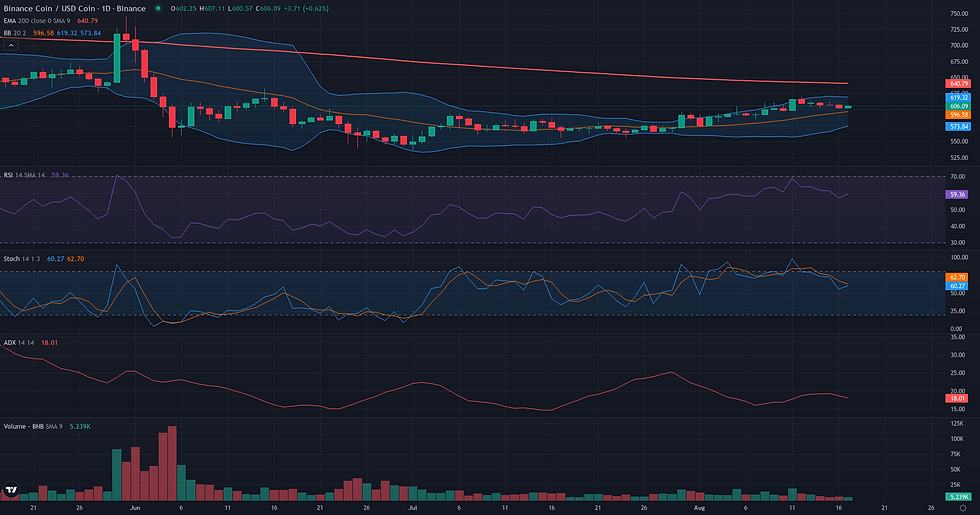
This BNB range rebound analysis examines the current BNB/USDC structure in the context of support defense and weakening alternative frameworks. BNB/USDC is currently in a state of deep consolidation, trading around 602.38 with a distinct lack of directional momentum. This is technically confirmed by extremely low trend strength readings on both the daily (ADX at 18.68) and weekly (ADX at 12.96) timeframes, indicating a market primarily driven by range-bound mechanics rather than a clear trend. The price is situated between its 50-day EMA (590.62) and a recent resistance cluster around 620.00, while being framed by major long-term structural levels: the 200-week EMA support at 570.38 and the 50-week EMA resistance at 679.83. This technical picture of a contained, low-volatility environment aligns with the latest fundamental analysis, which highlights BNB's relative stability and subdued price action amidst broader market uncertainty. The current structure suggests a period of balance, where neither bullish nor bearish forces have established definitive control, leading to the coiling price action observed over the past week.

BNB Range Rebound Analysis: Support and Friction Zones
The resolution for the BNB/USDC Range/Rebound framework hinges on the market's interaction with the validation zone identified at [555.57 - 569.89]. This zone represents a critical confluence of support, anchored by the long-term W1 EMA 200 (570.38) and the D1 swing low of 555.57. The framework would lose its technical coherence, and the rebound thesis would be invalidated, if the price were to achieve a sustained daily close below this 555.57 level, signaling a definitive structural breakdown. Should the price test this zone and a rebound begin to materialize, it would not be without obstacles. The first friction zone lies around the D1 EMA 50 at 590.62, a key dynamic pivot. Overcoming this would bring the more formidable resistance cluster of 616-620 USDC into focus, an area reinforced by the weekly R1 pivot (615.97) and recent daily highs. A successful move through these friction points would confirm the rebound's strength. If the framework resolves successfully, the technical projection zones point towards the upper boundaries of the established range. The first major reference is the D1 EMA 200 at 655.35, followed by the more significant macro resistance of the W1 EMA 50 at 679.83. Confirmation of the rebound requires holding the validation zone and reclaiming key levels above it, while a daily close below the W1 EMA 200 would be a significant sign of weakening, questioning the strength of this long-term support.

Breakout: Structural Catalyst Assessment
The Breakout framework for BNB/USDC is currently assessed as borderline due to a significant tension between a promising daily chart structure and a lackluster broader market context. On the daily timeframe, a classic pre-breakout scenario is taking shape. Price has established a clear resistance ceiling at 620.00, a level reinforced by the 20-day Donchian Channel upper boundary and the peak of the prior week. For the past several sessions, the price has been consolidating in a tight range just below this level, holding constructively above its 50-day EMA (590.62). This type of compression is often the precursor to a significant directional move. However, this bullish structure is not yet supported by underlying dynamics. The daily Volume Oscillator (-25.95) remains negative, indicating that recent price action lacks strong participation, while the ADX (18.68) confirms a weak trend. More importantly, the weekly context offers considerable friction. The weekly RSI (44.48) is below the neutral 50 mark, and the price remains far under the weekly 50-period EMA (679.83), suggesting the primary trend does not yet favor a sustained upside move. This conflict between the clean D1 setup and the unsupportive weekly and volume data is what makes the framework borderline rather than fully plausible.

Continuation: Directional Flow Assessment
The technical structure for a bullish continuation is present but lacks conviction, rendering the framework borderline. On the daily chart, the price has established a sequence of higher highs and lows since late July, culminating in a recent peak at 620.00. The current pullback appears contained, with the price holding above the dynamic support of the EMA 50 D1 (590.62) and showing signs of a bounce on the H1 timeframe. This local uptrend forms the primary basis for a continuation scenario. However, this bullish structure is set against a backdrop of significant weakness in trend momentum. The ADX D1 indicator, at a low 18.68, signals a distinct lack of directional strength, which is a core contradiction to the "Stable Directional Flow" signature sought by this framework. This weakness is echoed on the weekly chart, where the ADX W1 (12.96) and RSI W1 (44.48) both point to a ranging, rather than trending, market. Structurally, the price is caught between long-term support (EMA 200 W1 at 570.38) and major overhead resistance (EMA 200 D1 at 655.35), reinforcing the idea of a broader consolidation. Therefore, while a push higher is possible, the lack of underlying trend strength makes the continuation thesis tenuous and suggests any upward move may struggle for sustainability.

Comparative Framework Verdict
Comparing the three technical frameworks, the market structure for BNB/USDC most convincingly supports the Range/Rebound scenario, which is assessed as plausible. This view is anchored in the compelling evidence of a non-trending market, highlighted by very low ADX readings on both daily and weekly charts. The framework identifies a robust support confluence between 555.57 and 569.89, centered on the critical 200-week EMA, providing a logical foundation for a potential rebound within the broader consolidation. In contrast, both the Breakout and Continuation frameworks are rated as borderline. Their shared weakness is a fundamental contradiction with the current market state: they both presuppose a directional move in an environment that explicitly lacks momentum and trend strength. The Breakout framework presents a coherent setup with price coiling below the 620.00 resistance, but it is undermined by negative volume readings and a weak weekly backdrop. The Continuation framework is the weakest of the three, as its core premise of a 'stable directional flow' is directly refuted by the low ADX data. While a local uptrend exists, it appears more like a movement within a range than a sustainable trend. Ultimately, the analysis points towards a period of continued consolidation. The key development to monitor will be whether price action remains contained between the major support near 570 and resistance at 620, or if a significant shift in volume and momentum begins to lend credibility to a potential breakout.
For broader market context, readers can also review the latest related fundamental analysis for this pair.
For live market monitoring and the full interactive chart, readers can access the dedicated BNB Market Hub.
Disclaimer
CopyTradia provides technical analysis for informational and educational purposes only. This content does not constitute financial advice, investment recommendations, or trading signals. Cryptocurrency markets are highly volatile. Past performance is not indicative of future results. Always conduct your own research (DYOR) and consult a qualified financial advisor before making any investment decisions.


