BNB Price Compression Analysis: Key Support and Resistance

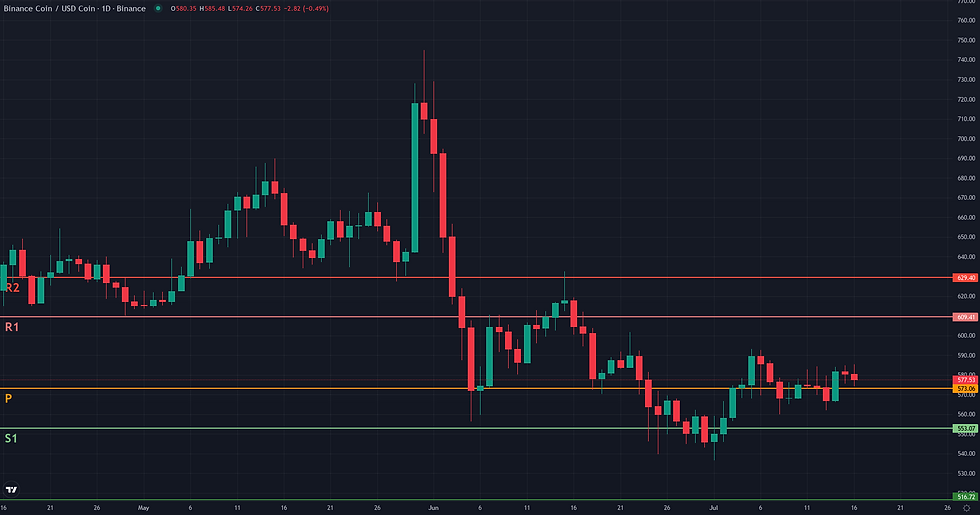
This BNB price compression analysis examines the current BNB/USDC structure in the context of support defense and weakening alternative frameworks. BNB/USDC is currently in a state of technical equilibrium, characterized by a distinct consolidation phase. The price is trading in a narrowing range, caught between the long-term support of the weekly 200-period EMA around 569.50 and short-term resistance near the daily 50-period EMA at 590.39. This structural indecision is quantitatively confirmed by key indicators. The daily ADX reading is exceptionally low at 14.84, signaling a clear absence of a directional trend, while the daily RSI hovers around the neutral 51 mark, indicating a lack of momentum. This technical consolidation aligns with the latest fundamental analysis, which points to a period of subdued volatility and diminished bullish bias, characterizing the market as one of relative weakness. The current market structure sets the stage for a potential directional move, but the conditions for such a move have not yet been met, leaving the asset in a state of compression.
BNB Price Compression Analysis: Technical Framework Assessment
The resolution for the BNB/USDC Range/Rebound framework is centered on the price structure's ability to overcome a key resistance ceiling. The validation for this borderline framework remains a confirmed break above the 593.05 USDC weekly high. The current 4H context shows a market in a state of indecision, characterized by low trend strength (ADX 4H at 17.54) and neutral momentum, reinforcing the range-bound behavior. The invalidation of this rebound scenario would occur with a structural failure of its support foundation. A sustained daily close below the W1 EMA 200 at 569.50, followed by a break of the recent 536.71 low, would signal that the stabilization has failed and the prior downtrend is likely to resume. Between the current price and a potential confirmation, two significant friction zones exist. The first is an immediate hurdle around 585 USDC, marked by recent 4H peaks and the D1 R1 pivot. A more formidable barrier lies at the 590-593 USDC confluence, which includes the D1 EMA 50. This zone represents the primary test for buyers. Should the framework validate with a decisive move through this resistance, technical projection zones can be identified at the W1 R1 pivot of 609.41 and subsequently at the W1 R2 of 629.40. The D1 EMA 200 at 680.66 stands as a major long-term structural reference. Confirmation would require a breakout with volume support, while a rejection from the friction zones would weaken the framework, risking a retest of the weekly support.


Breakout: Structural Catalyst Assessment
The Breakout framework for BNB/USDC presents a borderline case, characterized by a significant tension between a constructive daily price structure and a lack of confirmatory momentum. On one hand, the chart displays a classic pre-breakout consolidation. For the past two weeks, price has been coiling within a tightening range, establishing a clear resistance ceiling around the 593.05 USDC mark, which aligns with the Donchian 20-day high. This compression is supported by a notable decrease in market activity; the D1 Volume Oscillator is negative (-28.56) and the ADX is very low (14.84), signaling a quiet, trendless state often preceding a sharp directional move. On the other hand, this structural potential is not yet backed by dynamic strength. The D1 RSI hovers neutrally at 51.04, indicating an absence of the bullish pressure needed to fuel a convincing break. Furthermore, the weekly context acts as a major headwind, with price situated below key long-term moving averages and a weak W1 RSI (41.53). This creates a scenario where the structure is primed for a breakout, but the underlying forces to sustain it are currently missing, making the framework technically plausible but highly conditional.

Continuation: Directional Flow Assessment
The technical structure for BNB/USDC currently invalidates the Continuation framework. The primary condition for this strategy—a stable and established directional flow—is absent. Instead, the daily chart reveals a market in a state of consolidation and indecision. This is quantitatively confirmed by a D1 ADX value of 14.84, well below the threshold for a trending market, and a neutral D1 RSI of 51.04, which signals a balance of power between buyers and sellers. Structurally, the price is caught in a tight range. It is trading below the D1 EMA 50 (590.39), which is acting as a short-term dynamic resistance, while finding support on the long-term W1 EMA 200 (569.50). This compression between two key moving averages from different timeframes highlights the current structural conflict. The recent price action is characterized by small-bodied candles and declining volume (Volume Oscillator at -28.56), further reinforcing the lack of directional conviction. For a Continuation scenario to become plausible, the market would first need to establish a clear trend by breaking out of this range, ideally with a sustained move above the D1 EMA 50 and the recent weekly high of 593.05, supported by a rise in both momentum (ADX > 20) and volume.

Comparative Framework Verdict
In assessing the three technical frameworks for BNB/USDC, the market's current state of consolidation renders a clear directional bias difficult to establish. The Continuation framework is rated 'not_plausible' due to the unambiguous lack of a trend, as confirmed by a very low daily ADX of 14.84. The prevailing market condition is one of sideways movement, not directional flow, making this scenario invalid for now. Both the Range/Rebound and Breakout frameworks are assessed as 'borderline'. This shared rating reflects the market's indecision. Both frameworks correctly identify the same core technical picture: a price compression below a critical resistance ceiling around 593.05 while holding above major weekly support. The Range/Rebound framework focuses on the stabilization above the W1 EMA 200, while the Breakout framework highlights the coiling price action as a precursor to a potential move. However, both are weakened by the same factors: neutral momentum and a bearish broader market context. Neither framework presents a more compelling case than the other; they are two different interpretations of the same holding pattern. Consequently, no single framework can be considered dominant. The resolution of this consolidation, either by a decisive break above 593.05 or a failure of support around 569.50, will be critical in determining the market's next structural phase.
For broader market context, readers can also review the latest related fundamental analysis for this pair.
For live market monitoring and the full interactive chart, readers can access the dedicated BNB Market Hub.
Disclaimer
CopyTradia provides technical analysis for informational and educational purposes only. This content does not constitute financial advice, investment recommendations, or trading signals. Cryptocurrency markets are highly volatile. Past performance is not indicative of future results. Always conduct your own research (DYOR) and consult a qualified financial advisor before making any investment decisions.


