BNB Market Dynamics Show Underperformance Amidst Reduced Volatility

BNB has concluded the week exhibiting a regime of reduced volatility and continued underperformance relative to Bitcoin. While overall price changes have been minimal, underlying derivatives data indicates a persistent long-heavy liquidation profile, introducing a layer of speculative tension within the current BNB market dynamics.
BNB Spot Price and Volatility
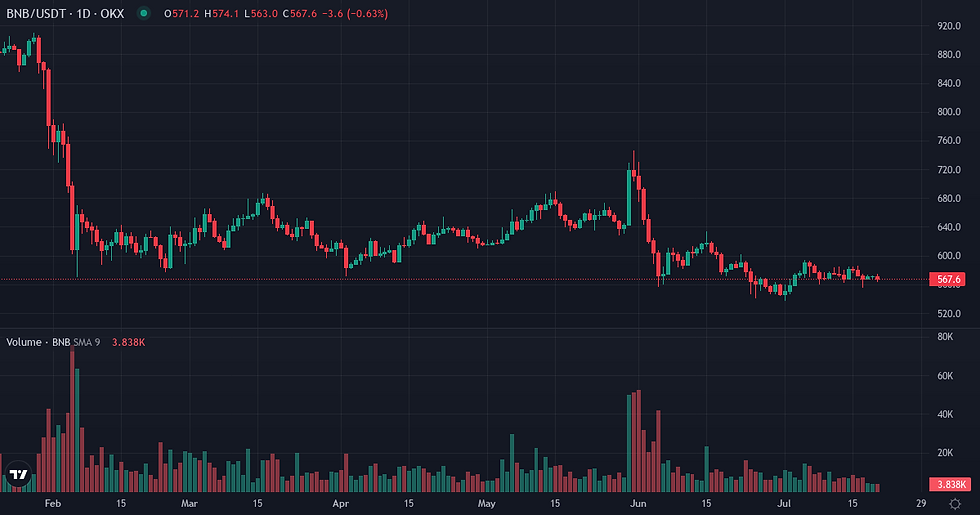
The past week saw BNB's spot price consolidate around $567.12, with a minor 7-day decline of 0.13% and a 30-day decrease of 3.22%. Realized volatility for both the 7-day (35.67%) and 30-day (33.08%) periods remained below the 90-day baseline of 42.35%, indicating a quieter trading environment. Against Bitcoin, BNB experienced a 2.51% relative underperformance over the last seven days, with its pair/BTC ratio declining from 0.009056 to 0.008829. This trend extends to a 3.63% underperformance over the past 30 days. The asset maintains a high 30-day correlation of 0.8914 with Bitcoin, alongside a Beta of 0.807, suggesting its price movements largely mirror the broader market leader but with slightly less amplitude. BNB remains 58.60% below its all-time high.

Metric | Value |
BNB Price | $567.12 (-0.37% 24h / -0.13% 7d / -3.22% 30d) |
Volume 24h | $519.6M |
Native Quote Vol. 24h | $2.3M |
Market Cap | $75.54B |
Market Cap Rank | 4 |
Circulating Supply | 133.17M BNB |
ATH Distance | 58.60% below ATH |
Metric | Value |
BNB/BTC Ratio | 0.008829 |
Relative Perf. 7d vs BTC | -2.51% |
Relative Perf. 30d vs BTC | -3.63% |
BNB Speculative Positioning Analysis
Speculative positioning for BNB shows a nuanced picture. Open Interest increased by 2.78% over the week to $0.331 billion, yet it remains below its 90-day baseline of $0.354 billion, indicating that while leveraged exposure has seen a slight uptick, it has not fully recovered to prior levels. The 30-day funding Z-score of -1.0270 suggests that funding rates are currently below their 30-day average of 0.005013%, which can reflect less aggressive long positioning or a balance in directional interest. However, the liquidation profile reveals a persistent long-heavy skew, with 77.7% of the $24.1 million in liquidations over the past seven days being long positions. This aligns with the 30-day average where 63.0% of liquidations were long, highlighting a continued vulnerability for leveraged long exposure.
Metric | Value |
Funding Rate (current) | +0.0000% |
Funding Cumul. 7d | +0.0461% |
Open Interest | $0.33B (+2.78% 7d) |
Liq. 24h Longs | $0M |
Liq. 24h Shorts | $0M |
Liq. 7d Longs | $19M |
Liq. 7d Shorts | $5M |
Metric | Value |
Realized Vol 7d | +35.67% (90d avg: +42.35%) |
Realized Vol 30d | +33.08% |
Corr. BTC 30d | 0.8914 (90d avg: 0.7757) |
Beta vs BTC | 0.8071 |
Volume Momentum | 0.6125x |
Funding Z-Score 30d | -1.03σ |
Turnover Ratio | 0.0069 |
Liq. Intensity | 0.00032 |
Key Monitoring Conditions for BNB
Monitoring conditions for the upcoming week include observing whether BNB's relative underperformance against Bitcoin persists, particularly if the broader crypto market shows a clear directional bias. A sustained decline in the BNB/BTC ratio could signal a further shift in capital allocation. The evolution of Open Interest will also be key; a decisive move above its 90-day baseline could indicate renewed leveraged participation, while a continued stagnation or decline would suggest ongoing deleveraging. Furthermore, the broader macroeconomic context, specifically the Unemployment Claims data scheduled for July 23rd, could introduce external volatility that interacts with BNB's internal market dynamics, potentially impacting its correlation with Bitcoin and overall market sentiment.
Indicator | Value | Variation |
Broad Dollar Index | 120.50 | flat (7d) |
US 10Y Yield | 4.57% | -0.05pp (7d) |
Fed Balance Sheet | $6743B | +$7,419M (7d) |
M2 Money Supply | $23,052B | +$247.8B (1m) |
Fear & Greed | 29 (Fear) | +7 pts (7d) |
Fear & Greed Index: Alternative.me
BNB Weekly Takeaway
At the close of the week, BNB presents a market characterized by subdued volatility and a consistent trend of underperformance against Bitcoin. The internal regime reflects a period of consolidation, yet the derivatives market indicates a clear underlying tension from a long-heavy liquidation profile. This suggests that while price action has been relatively quiet, leveraged long positions remain susceptible to market shifts, framing the current BNB environment as one requiring careful attention to both its relative strength and the composition of speculative exposure.
Disclaimer
This analysis of BNB market dynamics provides a fundamental overview for informational purposes only and does not constitute investment advice or a recommendation to buy or sell any asset.


