BNB Market Dynamics: Sustained Momentum and Expanding Speculative Interest

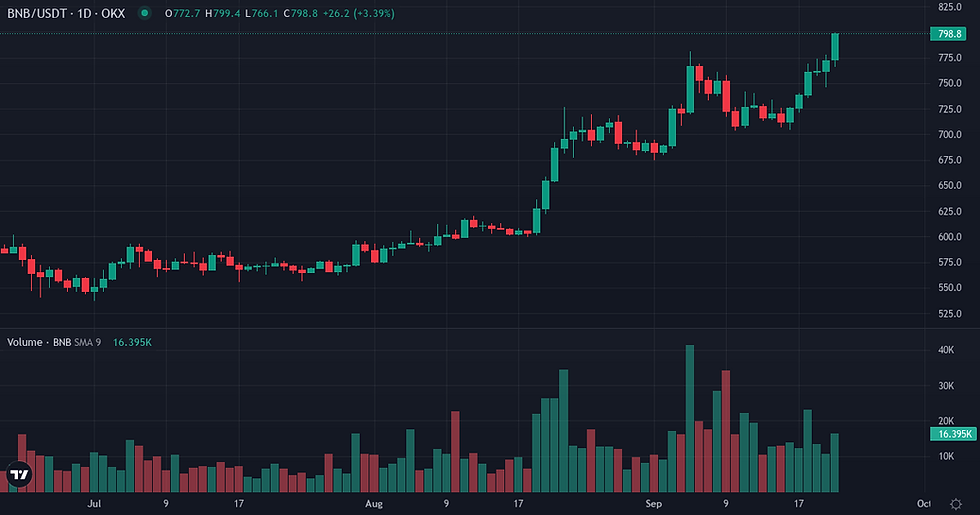
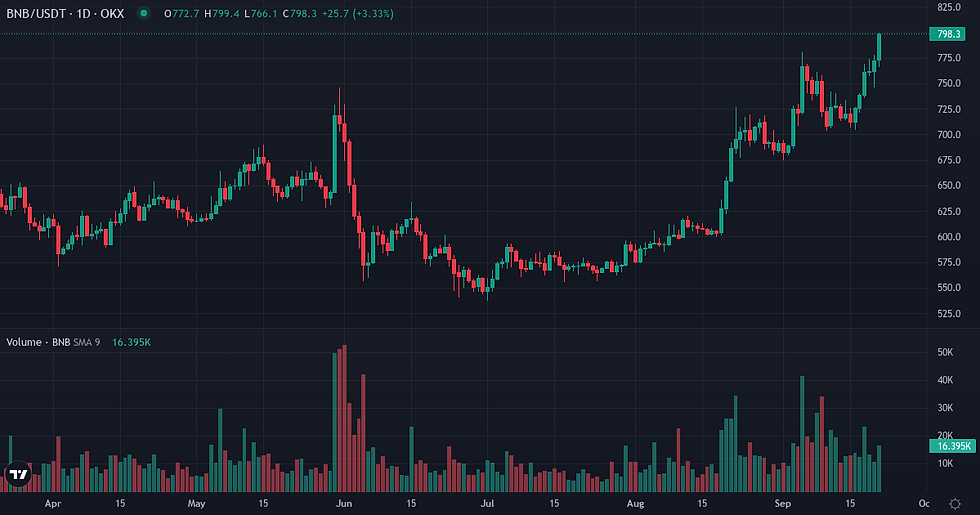
BNB concluded the week demonstrating sustained upward momentum in its spot price, accompanied by a notable expansion in leveraged positioning. The asset recorded a 10.37% gain over the past seven days, extending its 30-day increase to 14.33%, while maintaining its position as the fourth-largest cryptocurrency by market capitalization. This price appreciation occurred alongside a significant rise in Open Interest, indicating growing speculative engagement within the BNB market dynamics.
BNB Spot Price and Volatility
BNB experienced a notable 10.37% increase over the past week, extending its 30-day gain to 14.33%, with its spot price settling at $796.54. The asset maintains a market capitalization of $106.042 billion, ranking fourth globally, and currently stands 41.86% below its all-time high. The 7-day realized volatility of 36.13% remained close to its 90-day baseline of 37.85%, suggesting the recent price movement occurred within established volatility norms rather than an abrupt shift. Against Bitcoin, BNB demonstrated positive relative performance, with a 0.4194% gain over seven days and a more substantial 6.7390% gain over 30 days, indicating an autonomous strength beyond general market movements.
Metric | Value |
BNB Price | $796.54 (+5.69% 24h / +10.37% 7d / +14.33% 30d) |
Volume 24h | $1.70B |
Native Quote Vol. 24h | $7.3M |
Market Cap | $106.04B |
Market Cap Rank | 4 |
Circulating Supply | 133.16M BNB |
ATH Distance | 41.86% below ATH |
Metric | Value |
BNB/BTC Ratio | 0.009359 |
Relative Perf. 7d vs BTC | +0.42% |
Relative Perf. 30d vs BTC | +6.74% |
Expanding Speculative Interest in BNB
Speculative interest in BNB expanded significantly, with Open Interest increasing by 20.47% over the past week to $0.518 billion, notably above its 90-day baseline of $0.379 billion. This indicates a broader engagement of leveraged capital. The current funding rate stands at 0.010403%, contributing to a 7-day cumulative rate of 0.035499%. The 30-day Funding Z-Score of 1.7730 is elevated, reflecting a pronounced positive bias among leveraged traders relative to its historical average. Despite the price appreciation, liquidations over the past seven days were balanced, with long and short positions each accounting for approximately $16.4 million, and the 30-day average liquidation profile also showing a balanced directional skew, suggesting the rally was not primarily driven by aggressive short squeezes or long flushes.
Metric | Value |
Funding Rate (current) | +0.0104% |
Funding Cumul. 7d | +0.0355% |
Open Interest | $0.52B (+20.47% 7d) |
Liq. 24h Longs | $0M |
Liq. 24h Shorts | $2M |
Liq. 7d Longs | $16M |
Liq. 7d Shorts | $16M |
Metric | Value |
Realized Vol 7d | +36.13% (90d avg: +37.85%) |
Realized Vol 30d | +48.30% |
Corr. BTC 30d | 0.6716 (90d avg: 0.7149) |
Beta vs BTC | 0.8921 |
Volume Momentum | 0.6972x |
Funding Z-Score 30d | 1.77σ |
Turnover Ratio | 0.0161 |
Liq. Intensity | 0.00031 |
Key Monitoring Conditions for BNB
Monitoring conditions for the upcoming week include observing whether the current price appreciation is accompanied by a sustained return of 24-hour trading volume above its 7-day average, as the current volume momentum of 0.697 suggests recent volume is below the weekly average. A continued deceleration in volume alongside price gains could signal weakening conviction. Furthermore, the persistence of elevated Open Interest and positive funding rates will indicate sustained leveraged bullish positioning; any sharp reversal in funding or a significant contraction in Open Interest could signal a shift in speculative sentiment. Finally, BNB's ability to maintain or further amplify its outperformance against Bitcoin, particularly in the context of the upcoming Unemployment Claims data on September 24th, will be crucial for confirming its autonomous strength.
Indicator | Value | Variation |
Broad Dollar Index | 118.21 | flat (7d) |
US 10Y Yield | 4.94% | -0.03pp (7d) |
Fed Balance Sheet | $6747B | +$5,929M (7d) |
M2 Money Supply | $23,218B | +$102.8B (1m) |
Fear & Greed | 70 (Greed) | +1 pts (7d) |
Fear & Greed Index: Alternative.me
BNB Weekly Takeaway
BNB closed the week in a regime characterized by sustained spot price momentum and expanding leveraged interest. The asset's outperformance against Bitcoin suggests an internal strength, while elevated funding rates reflect a strong bullish bias in derivatives. Although speculative positioning has increased, the balanced liquidation profile indicates that the rally has not been dominated by aggressive squeezes. This combination points to a market where positive price action is attracting and sustaining capital, suggesting a coherent internal regime for swing traders to consider in their exposure decisions.
Disclaimer
This article provides a purely analytical perspective on BNB's market dynamics and does not constitute investment advice or a recommendation to buy or sell any asset.


