BNB Continuation Analysis: Consolidation Tightens

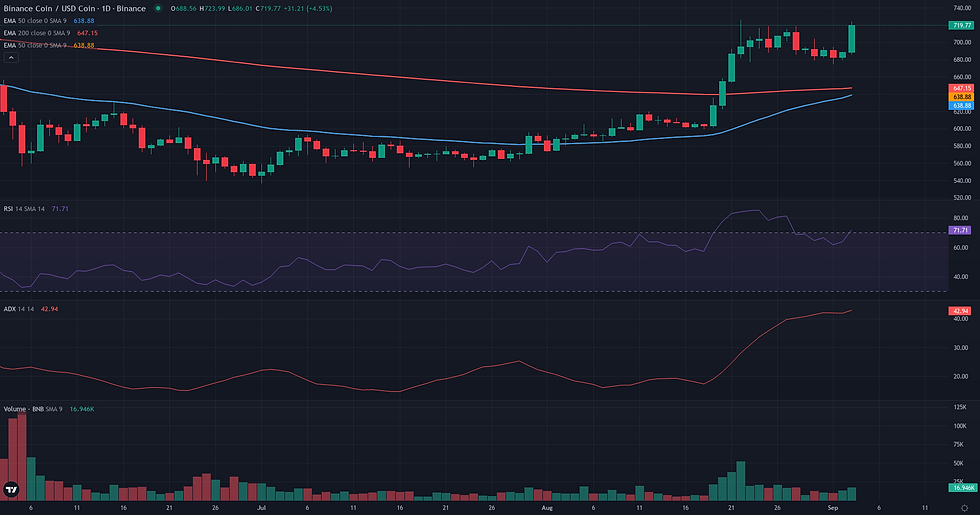
This BNB continuation analysis examines the current BNB/USDC structure in the context of support defense and weakening alternative frameworks. BNB/USDC is currently in a phase of tight consolidation following a powerful bullish impulse that peaked above 725 USDC. The daily chart reveals a market holding its gains, with price trading comfortably above key moving averages like the D1 EMA 200 at 655.05 and the W1 EMA 50 at 680.87. Momentum indicators reflect this constructive pause; the D1 ADX is high at 41.87, signaling a strong underlying trend, while the D1 RSI at 63.68 suggests bullish momentum remains intact without being overextended. This technical posture of consolidation under a key resistance level aligns with recent fundamental observations of contracting volatility and a more contained market environment, suggesting a build-up of energy rather than directional exhaustion. The current structure sets the stage for conflicting interpretations, pitting potential trend continuation against the possibility of a deeper pullback.
Range & Rebound Resolution: Support and Friction Zones
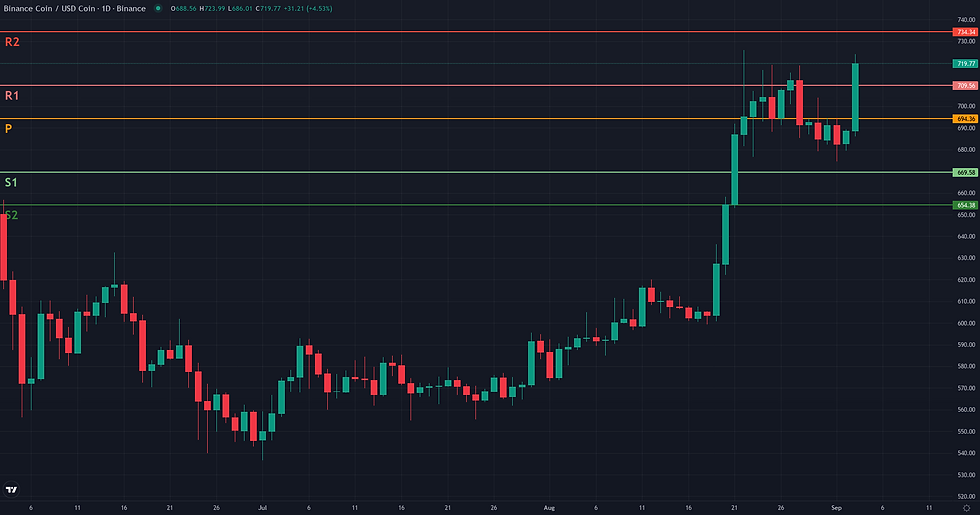
Following the borderline assessment in the entry phase, the resolution analysis for BNB/USDC's Range/Rebound framework reveals a dynamic situation. The initial hypothesis centered on a rebound from the 667.10 - 669.58 USDC validation zone. However, the market demonstrated strong underlying demand by reversing its pullback ahead of this area, finding support near the W1 EMA 50 (680.87) and establishing a low at 674.42 USDC. A vigorous rebound has since unfolded, confirming buyer interest but also immediately bringing the price into contact with key resistance levels. The primary friction zone is the current area around the W1 R1 pivot at 709.56 USDC. Should this be overcome, the next significant obstacle is the supply zone defined by the recent swing highs of 719.13 to 725.92 USDC. A sustained move above this cluster would serve as a strong confirmation that the corrective phase has concluded. In such a scenario, the technical projection points towards the W1 R2 pivot at 734.34 USDC as the next major reference. Conversely, the framework's coherence would weaken if the current rebound is rejected and the price falls back below the W1 Pivot at 694.36 USDC. This would suggest the bounce lacks conviction. The definitive invalidation condition for the rebound thesis would be a daily close below the D1 EMA 200 at 655.05 USDC, which would signal a deeper, more structural correction is underway.
Breakout: Structural Catalyst Assessment
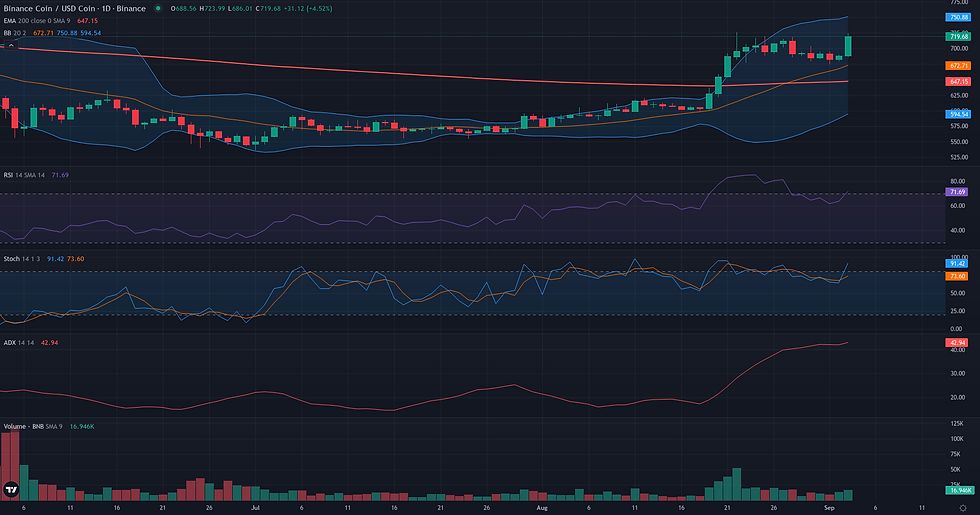
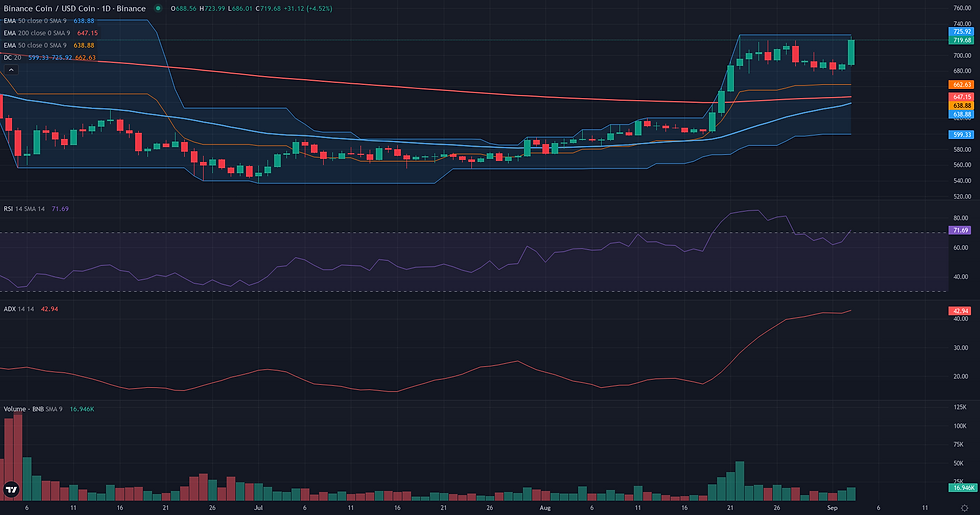
The current market structure presents a plausible breakout scenario. Following a powerful rally in mid-August that culminated at 725.92, the price has entered a phase of horizontal consolidation. This price action is constructive, forming a technical base just below this key resistance, which corresponds to the 20-day Donchian channel high. The daily trend remains strong, as evidenced by an ADX of 41.87, while the RSI at 63.68 indicates that momentum is healthy but not yet overextended. This suggests a potential build-up of energy for a continuation move. However, two factors temper this reading. First, the Volume Oscillator at -19.56 highlights that this consolidation is occurring on lower-than-average volume, raising questions about conviction. Second, the weekly context is less clear, with a low ADX of 15.44 indicating a lack of a strong directional trend on the higher timeframe. Despite these points of friction, the clarity of the D1 consolidation pattern below a well-defined resistance makes the breakout framework technically coherent and worthy of evaluation.
BNB Continuation Analysis: Directional Flow Assessment
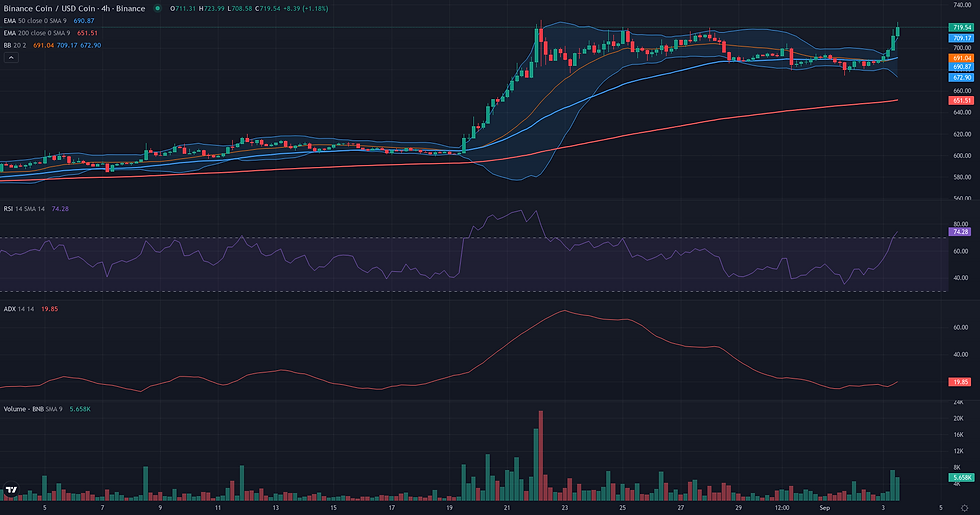
The technical structure for BNB/USDC presents a plausible continuation scenario. The daily chart is defined by a powerful bullish impulse that peaked at 725.92, followed by a multi-day consolidation. This structure is underpinned by strong directional momentum, as evidenced by a D1 ADX reading of 41.87. During this consolidation, price has remained constructively positioned above key supports, notably the weekly EMA 50 at 680.87, while volume has receded (Volume Oscillator at -19.56), a classic sign of a healthy pause rather than a reversal. The D1 RSI at 63.68 confirms that bullish momentum is intact with further upside potential. A moderating factor is the weekly context, where a low W1 ADX of 15.44 suggests the broader trend is not yet strongly established, which may impact the move's ultimate sustainability. Furthermore, the immediate H1 timeframe shows a sharp breakout with a highly overbought RSI (84.60), hinting at the possibility of short-term volatility. Despite these points of caution, the dominant daily structure of a strong trend followed by an orderly consolidation supports the technical plausibility of the continuation framework.
Comparative Framework Verdict
In assessing the three technical frameworks for BNB/USDC, a clear hierarchy emerges based on the dominant market characteristic: a strong underlying trend. Both the Continuation and Breakout frameworks are rated as 'plausible', as they correctly interpret the current sideways price action as a healthy consolidation or pause. They both identify the critical resistance zone between 719.13 and 725.92 as the key level to watch for a resumption of the uptrend, a view strongly supported by the high D1 ADX reading of 41.87. Between the two, the Continuation framework offers a slightly broader and more robust interpretation of the overall market structure. In contrast, the Range/Rebound framework is deemed 'borderline'. Its core premise of a range-bound environment is challenged by the very trend strength that supports the other two scenarios. While it correctly identified a potential support area, the market's rebound initiated from a higher level, front-running the validation zone. This behavior reinforces the narrative of underlying buyer strength consistent with a trend continuation, not a simple range oscillation. Looking ahead, the resolution of the current consolidation will be telling. A decisive breakout above the 725.92 high would validate the dominant Continuation and Breakout theses, while a failure to overcome this resistance could lend temporary credence to a more significant corrective phase.
For broader market context, readers can also review the latest related fundamental analysis for this pair.
For live market monitoring and the full interactive chart, readers can access the dedicated BNB Market Hub.
Disclaimer
CopyTradia provides technical analysis for informational and educational purposes only. This content does not constitute financial advice, investment recommendations, or trading signals. Cryptocurrency markets are highly volatile. Past performance is not indicative of future results. Always conduct your own research (DYOR) and consult a qualified financial advisor before making any investment decisions.


