BNB Bullish Breakout Analysis: Consolidation Below $807

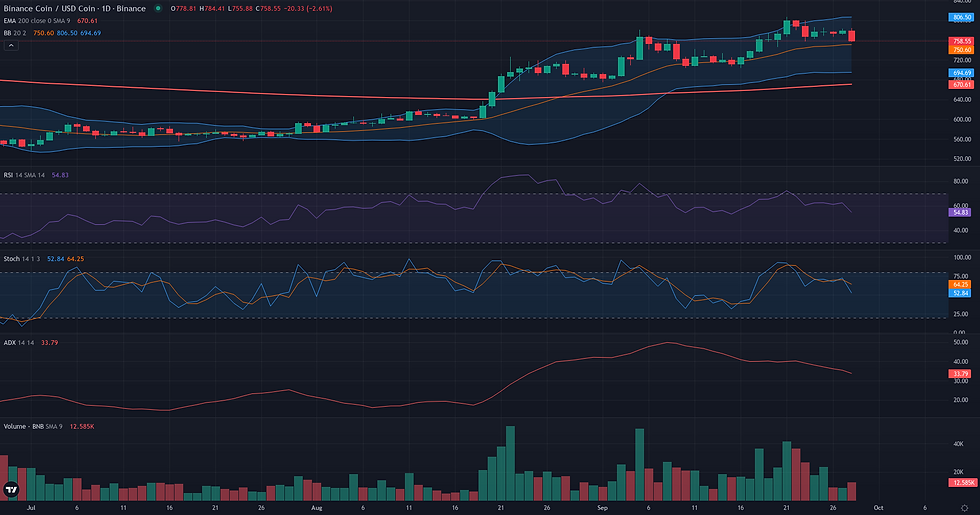
This BNB bullish breakout analysis examines the current BNB/USDC structure in the context of support defense and weakening alternative frameworks. BNB/USDC is currently in a phase of high-level consolidation after a strong bullish impulse, with the price holding near $778. The market structure is defined by a powerful underlying uptrend, confirmed by a high D1 ADX reading of 39.04 and sustained bullish momentum, with the D1 RSI at 62.43. Price action is well supported above all key long-term moving averages, indicating firm directional control by buyers. The current sideways movement between last week's high of $807.35 and low of $756.92 appears constructive, characterized by diminishing volume. This technical pause aligns with recent market data indicating a contraction in open interest and a moderation in leveraged speculative activity, suggesting the market is absorbing recent gains rather than preparing for a reversal. This sets the stage for a potential resolution where trend-following frameworks are most relevant.

Range & Rebound: Market Structure Assessment
The Range/Rebound framework is currently not plausible for BNB/USDC. The market structure is characterized by a strong, directional uptrend, which is fundamentally at odds with the conditions required for this framework—namely, price consolidation within a range or stabilization at a key support level. The daily chart shows a clear ascent from below 700 to a recent high of 807.35, a move confirmed as a strong trend by a D1 ADX reading of 39.04. Price is currently positioned well above its D1 200-period EMA (667.60) and is interacting with the upper Bollinger Band on the weekly timeframe (779.75), signaling bullish extension rather than a rebound opportunity from a low. Momentum indicators like the D1 RSI at 62.43 reinforce this reading of sustained bullish strength. For the Range/Rebound framework to become relevant, the market would first need to abandon its current directional character. This would require a halt to the uptrend and the subsequent formation of a clear horizontal structure with identifiable support and resistance levels, or a significant corrective move towards a major support zone where signs of deceleration could emerge.
BNB Bullish Breakout Analysis: Structural Catalyst Assessment
The Breakout framework appears technically plausible for BNB/USDC, based on a highly coherent market structure. The primary feature is a well-defined resistance zone around 805-807, anchored by the recent weekly high (807.35) and the Weekly R1 pivot (805.18). Instead of a sharp rejection from this level, the price has entered a phase of high-level consolidation over the past week, suggesting absorption of supply rather than a reversal. This structural preparation is strongly supported by underlying market dynamics. The daily trend strength is robust, with the ADX D1 reading a high 39.04, indicating a powerful directional move is in place. Furthermore, momentum is firmly bullish, with the D1 RSI at 62.43 and the W1 RSI at 63.47, both showing sustained strength without being overextended. The volume profile reinforces this reading: the initial push to the 807.35 high was on significant volume, while the subsequent consolidation has seen volume diminish, as confirmed by a Volume Oscillator of -24.17. This pattern is characteristic of a market pausing and building energy before a potential continuation, making the structure highly readable for a breakout scenario.
Continuation: Directional Flow Assessment
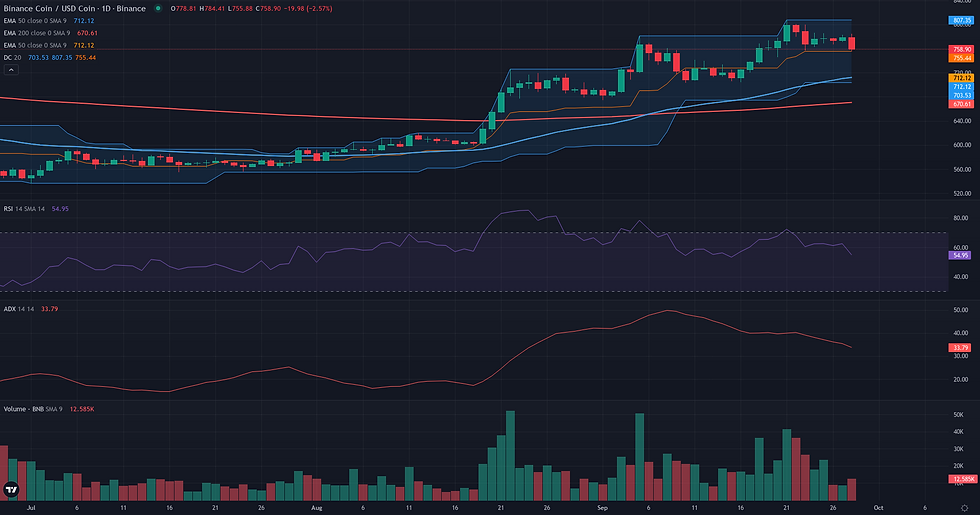
The current market structure for BNB/USDC presents a technically plausible case for a bullish continuation. The primary directional flow is clearly upward, with price action well-established above key daily (EMA50 at 707.74) and weekly (EMA50 at 690.78) moving averages. The trend's strength is underscored by a high D1 ADX reading of 39.04. Following a strong impulse that peaked at 807.35, the price has entered a consolidation phase. This sideways movement appears constructive, as it is occurring on declining volume (Volume Oscillator D1 at -24.17) and has so far respected the recent weekly low of 756.92 as support. Momentum indicators align with this view, with both the D1 RSI (62.43) and W1 RSI (63.47) situated in bullish territory without showing signs of exhaustion. The main point of friction is on the micro-level H1 chart, where recent price action shows some weakness. However, this does not currently compromise the integrity of the broader D1 structure. Overall, the combination of a strong underlying trend, a healthy consolidation, and supportive momentum provides a coherent basis for the Continuation framework.

Comparative Framework Verdict
Comparing the three technical frameworks reveals a clear consensus favoring trend-following scenarios. Both the Breakout and Continuation frameworks are assessed as plausible, while the Range/Rebound framework is deemed not plausible given the current market dynamics. The Breakout framework emerges as the most dominant technical reading. It precisely identifies the key structural element: a well-defined horizontal resistance at the recent high of $807.35. The current price consolidation just below this level, on decreasing volume, presents a classic and highly coherent setup for a potential bullish breakout. This view is strongly supported by a high ADX reading and robust RSI figures, with the agent identifying no significant weakening factors. The Continuation framework is a strong secondary case, correctly interpreting the current pullback as a healthy pause within a larger uptrend. However, its focus is slightly broader, and its validation point is less critical than the multi-timeframe resistance highlighted by the Breakout scenario. The Range/Rebound framework is invalidated by the market's strong directional character, making it the weakest of the three. Consequently, monitoring the price action around the $756 support and the $807 resistance is key to assessing the market's next directional move.
For broader market context, readers can also review the latest related fundamental analysis for this pair.
For live market monitoring and the full interactive chart, readers can access the dedicated BNB Market Hub.
Disclaimer
CopyTradia provides technical analysis for informational and educational purposes only. This content does not constitute financial advice, investment recommendations, or trading signals. Cryptocurrency markets are highly volatile. Past performance is not indicative of future results. Always conduct your own research (DYOR) and consult a qualified financial advisor before making any investment decisions.


