BNB Breakout Analysis: Price Compresses Below $620

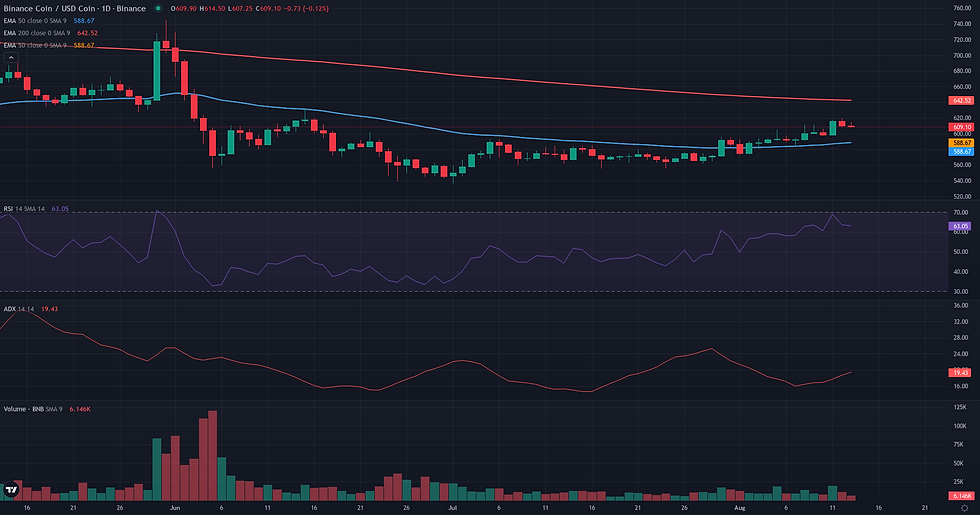
This BNB breakout analysis examines the current BNB/USDC structure in the context of support defense and weakening alternative frameworks. BNB/USDC is currently in a phase of tight consolidation, trading around the $610 mark after a notable recovery from its late July lows. The daily technical picture reflects this compression: momentum is constructive, with the D1 RSI holding firm at 63.64, but trend strength remains conspicuously absent, as shown by a low D1 ADX reading of 18.87. This suggests a market gathering energy rather than moving with conviction. Structurally, the price is holding above the critical 200-week EMA support near $570, a positive long-term sign, but is now pressing against immediate resistance. The current technical structure aligns with the latest fundamental analysis for this pair, which describes a period of consolidation with underlying positive momentum but within a subdued volatility environment. This sets the stage for a potential resolution where the market must either confirm a directional break or revert to range-bound behavior.

Range & Rebound: Market Structure Assessment
The Range/Rebound framework is assessed as not plausible at this time. While the market has clearly established a trading range, with a significant rebound originating from the W1 EMA 200 support at 570.09, the opportunity for an entry based on this framework appears to have passed. The price has already traversed the range and is now pressing against a confluence of resistance levels, including the W1 middle Bollinger Band at 610.07 and the D1 upper Bollinger Band at 616.00. Momentum indicators, specifically the D1 Stochastics at 83.81, are in overbought territory, suggesting the upward leg of the rebound is mature. The low D1 ADX reading of 18.87 confirms a non-trending, range-bound environment, but the current price location is unfavorable for initiating a rebound-based analysis. For this framework to become relevant again, the market would need to pull back and demonstrate a new phase of stabilization at a clearly defined support level.

BNB Breakout Analysis: Structural Catalyst Assessment
The Breakout framework appears technically plausible for BNB/USDC, centered on a clear structural compression below a multi-faceted resistance zone. Over the past two weeks, the price has staged a steady recovery, culminating in a tight consolidation directly beneath the 620.00 level. This level is technically significant, representing the 20-day Donchian Channel upper band and the highest price since late July. The preparation for a potential break is supported by healthy daily momentum, with the D1 RSI at 63.64 indicating bullish strength that is not yet overextended, and a positive Volume Oscillator (7.90) confirming buying interest on recent upswings. Contextually, the weekly chart provides a significant tailwind: price has recently reclaimed and is holding above its 200-week EMA (570.09), a classic sign of a potential macro trend shift. The primary limiting factor is the lack of confirmed trend strength; a low D1 ADX of 18.87 suggests the current market is in a low-trend or ranging state. While this can be characteristic of a pre-breakout compression, it also raises the risk of a failed attempt. However, the convergence of a readable price structure, supportive daily dynamics, and a constructive weekly posture provides a solid basis for considering the Breakout framework.

Continuation: Directional Flow Assessment
The continuation framework for BNB/USDC is currently assessed as borderline. The technical picture is defined by a significant tension between a constructive daily price structure and a lack of confirmed trend strength. On one hand, the recent price action is encouraging for a continuation scenario, having established a series of higher highs and lows since late July. This bullish sequence is supported by its position above two key moving averages: the daily EMA 50 (587.83) and, more significantly, the weekly EMA 200 (570.09), which it has recently reclaimed. The daily RSI at 63.64 further reinforces this short-term bullish momentum. However, this positive structure is not yet supported by strong directional energy. The daily ADX reading of 18.87 is low, indicating that the market is not in a strong, established trend, which tempers the reliability of a 'Stable Directional Flow'. This reading is compounded by a weekly RSI of 44.41, suggesting the higher timeframe context still lacks bullish conviction. Therefore, while the immediate structure is positive, the underlying weakness in trend strength makes the continuation plausible but not yet confirmed, warranting a borderline classification.
Comparative Framework Verdict
Comparing the three technical frameworks, the Breakout scenario emerges as the most plausible. This framework best captures the current market structure, which is characterized by a clear price compression directly beneath the well-defined resistance at $620. The plausibility of a potential upward break is supported by healthy daily momentum and the significant fact that the price has reclaimed and is holding above its 200-week EMA. A daily close above $620 would be required to validate this hypothesis. The Continuation framework is considered borderline. While it correctly identifies the bullish daily price structure—a series of higher highs and lows above the 50-day EMA—its core assumption of a stable trend is undermined by the very low D1 ADX reading of 18.87. This suggests the recent upward move is more of a recovery within a range than a confirmed, sustainable trend. Finally, the Range/Rebound framework is assessed as not plausible. Its logic is contextually inappropriate, as the rebound from the support zone around $570 has already occurred. The price is now positioned at the top of the recent trading range, challenging resistance, which is the opposite of the setup required for a rebound entry. The key element to monitor will be whether buying pressure can overcome the low-trend environment to force a resolution above resistance.
For broader market context, readers can also review the latest related fundamental analysis for this pair.
For live market monitoring and the full interactive chart, readers can access the dedicated BNB Market Hub.
Disclaimer
CopyTradia provides technical analysis for informational and educational purposes only. This content does not constitute financial advice, investment recommendations, or trading signals. Cryptocurrency markets are highly volatile. Past performance is not indicative of future results. Always conduct your own research (DYOR) and consult a qualified financial advisor before making any investment decisions.


