BNB Breakout Analysis: Price Consolidates Below $807 Resistance

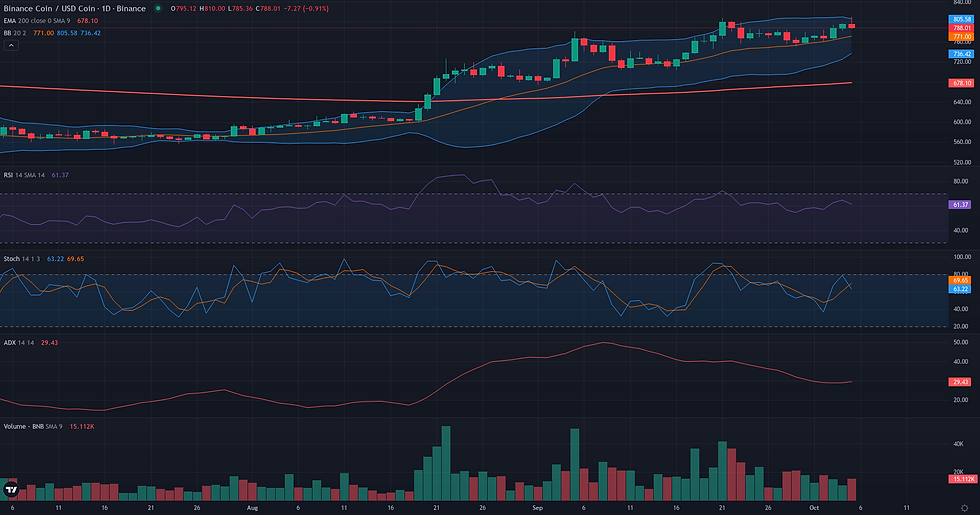
This BNB breakout analysis examines the current BNB/USDC structure in the context of support defense and weakening alternative frameworks. BNB/USDC is currently exhibiting a strong bullish structure, with the price consolidating near recent highs around the $795 level. The technical backdrop is defined by a clear directional trend, confirmed by a D1 ADX reading of 32.46, while bullish momentum remains solid with the D1 RSI at 64.59. Price action is holding firmly above all key long-term moving averages on both daily and weekly timeframes, reinforcing the positive market sentiment. This technical consolidation aligns with recent market analysis indicating a period of reduced volatility, which has paradoxically been accompanied by expanding leveraged interest, suggesting a build-up of positioning ahead of a potential directional move. The current price structure presents a market coiled for potential movement, with a clear resistance zone being tested after a period of sustained upward pressure.

Range & Rebound: Market Structure Assessment
The Range/Rebound framework is assessed as not plausible for BNB/USDC in the current market context. The primary reason for this conclusion is the dominant market structure, which is clearly trending rather than ranging. This is quantitatively supported by a D1 ADX reading of 32.46, indicating a directional environment that contradicts the framework's core requirement for consolidation or stabilization. Furthermore, the price is currently positioned near its recent highs and is challenging the W1 Upper Bollinger Band at 801.64. This context is typically associated with potential breakouts or reversals from resistance, not rebounds from a support level. While the last ten sessions have seen some sideways movement, this period is too brief to establish a reliable trading range. For the Range/Rebound framework to become relevant, the market would first need to demonstrate a significant loss of directional momentum, evidenced by the ADX falling below 25, and then establish a clear, multi-touch support and resistance structure over a more extended period.
BNB Breakout Analysis: Structural Catalyst Assessment
The Breakout framework is considered plausible for BNB/USDC due to a highly constructive market structure on the daily timeframe. For approximately two weeks, the price has been consolidating in a tight range immediately below the key resistance level of 807.35, which marks the peak of the recent uptrend and corresponds to the 20-day Donchian Channel high. This type of high-level consolidation is often a precursor to a continuation move. The bullish thesis is further supported by healthy momentum readings, with the D1 RSI at 64.59 and the W1 RSI at 64.92, both indicating underlying strength without being overbought. Additionally, a D1 ADX of 32.46 confirms that the market is in a trending mode. The primary factor that tempers this outlook is the recent volume profile; the D1 Volume Oscillator is negative at -21.06, suggesting that buying pressure has been subdued during this consolidation phase. While this warrants caution, the clarity of the structural preparation and the alignment of momentum across timeframes provide a solid technical basis for anticipating a potential breakout.

Continuation: Directional Flow Assessment
The technical structure for BNB/USDC presents a plausible case for a bullish continuation. The primary daily trend remains intact, characterized by a sequence of higher lows and a price holding firmly above key dynamic supports like the D1 EMA50 at 723.94. This directional flow is corroborated by a healthy D1 RSI of 64.59 and a D1 ADX of 32.46, confirming a trending market environment. The weekly context reinforces this view, with price action extending a multi-month uptrend well above its own structural moving averages. However, the reading is not without nuance. The recent push higher has not been accompanied by strong volume, as indicated by a negative D1 Volume Oscillator (-21.06). Furthermore, the price has so far failed to decisively break the prior swing high of 807.35, and short-term H1 data shows a recent rejection from the 810.00 area. This suggests that while the underlying structure is bullish, buying pressure may be moderating, potentially leading to a phase of consolidation before any further advance. The continuation framework is retained because the core bullish structure has not been invalidated, but these factors warrant careful observation.

Comparative Framework Verdict
In assessing the three technical frameworks for BNB/USDC, a clear directional bias emerges, with two plausible bullish scenarios and one non-trending framework deemed unsuitable. The Breakout framework stands out as the most dominant interpretation of the current market structure. It is assessed as plausible because it precisely captures the recent price action: a multi-day consolidation directly beneath the well-defined resistance at $807.35. This pattern, supported by a trending ADX and bullish RSI, is often a precursor to a continuation move. The Continuation framework is also considered plausible and serves as the secondary scenario. It supports the same bullish outlook by focusing on the broader uptrend, where the price remains above key moving averages. While valid, it is less specific about the immediate tactical picture compared to the Breakout framework. Conversely, the Range/Rebound framework is rated not plausible. The market's strong directional momentum, evidenced by an ADX well above 25, fundamentally contradicts the conditions required for a range-bound scenario. Consequently, the market's immediate direction appears contingent on the resolution of the current consolidation, with a decisive move above the $807 resistance being the key development to monitor.
For broader market context, readers can also review the latest related fundamental analysis for this pair.
For live market monitoring and the full interactive chart, readers can access the dedicated BNB Market Hub.
Disclaimer
CopyTradia provides technical analysis for informational and educational purposes only. This content does not constitute financial advice, investment recommendations, or trading signals. Cryptocurrency markets are highly volatile. Past performance is not indicative of future results. Always conduct your own research (DYOR) and consult a qualified financial advisor before making any investment decisions.


