BNB Breakout Analysis: Trend Pauses Below $807 Resistance

This BNB breakout analysis examines the current BNB/USDC structure in the context of support defense and weakening alternative frameworks. BNB/USDC is currently in a phase of consolidation after a significant upward trend, with the price holding above key long-term moving averages such as the daily EMA 200 at $674. The market structure reflects a pause in momentum rather than a reversal, supported by a daily ADX of 34.43, which indicates the underlying trend remains strong. The daily RSI at 57.81 confirms that bullish momentum is still present but is not yet in overbought territory, allowing room for further potential upside. Price action is currently contained within the previous week's range, between approximately $757 and $807. This technical consolidation aligns with recent fundamental observations of a moderation in leveraged speculative activity, suggesting the market is pausing to absorb supply rather than reversing course. This sets the stage for a critical test of either established support or the well-defined overhead resistance in the coming sessions.

Range & Rebound Resolution: Support and Friction Zones
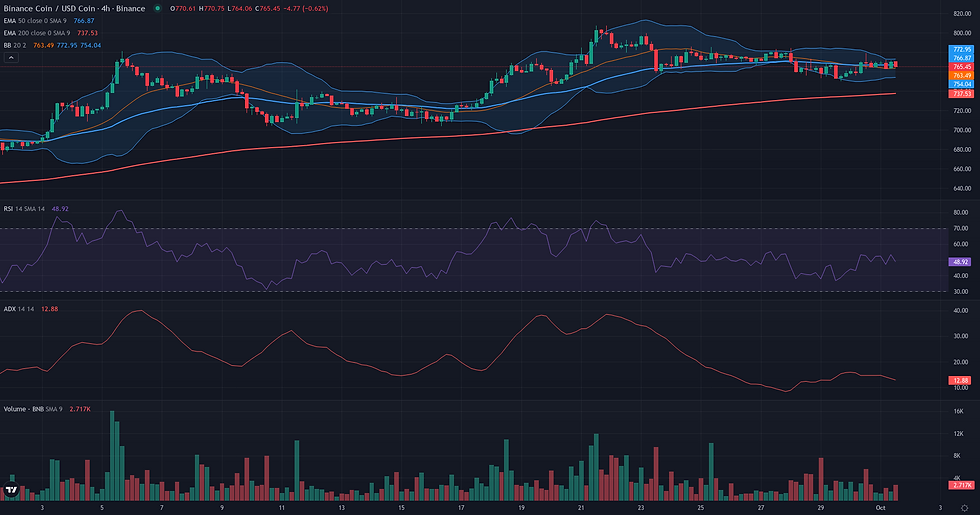
Following the borderline assessment of the Range/Rebound framework, the resolution analysis focuses on the defense of the 750.22 - 755.01 USDC support zone. The 4H price action confirms a recent test of this area with a low at 750.22, followed by a tentative bounce, providing an initial, albeit unconfirmed, validation. The market's character on this resolution timeframe, with a low ADX (13.90), is conducive to a ranging environment, lending credibility to the consolidation hypothesis. The framework's coherence hinges on its ability to overcome key resistance levels. The first significant friction zone lies at 779.88 - 781.05, a confluence of the daily R1 and weekly pivot points. A rejection here would weaken the rebound attempt, while a sustained break above would serve as a primary confirmation signal. If the rebound confirms, the main technical projection is the upper boundary of the potential range, a strong resistance cluster formed by the recent daily high of 807.35 and the weekly R1 pivot at 805.18. Conversely, the invalidation for this framework is clearly defined. A daily close below the 750.22 low would break the established support structure, negating the rebound scenario. A weakening of the framework would be signaled by a failure to clear the initial 781.05 friction and a subsequent retest of the support lows. The current price action represents a fragile equilibrium, and the resolution will depend on whether buyers can build momentum from this support base or if sellers will force a breakdown.

BNB Breakout Analysis: Structural Catalyst Assessment
The current market structure for BNB/USDC presents a technically plausible breakout scenario. A significant resistance zone has been clearly established around the 807.35 level, which corresponds to the high of September 21st and the upper boundary of the 20-day Donchian Channel. Following a test of this ceiling, the price has entered a consolidation phase, holding its ground rather than reversing sharply. This behavior is often characteristic of a market absorbing supply in preparation for another upward attempt. The underlying context is supportive, with a D1 ADX of 34.43 indicating a strong, established trend. Furthermore, momentum indicators on both daily (RSI 57.81) and weekly (RSI 63.47) timeframes remain in bullish territory without being overextended, suggesting capacity for further appreciation. The primary point of caution is the volume profile; the D1 Volume Oscillator is negative (-9.81), signaling that recent trading activity is below average. While this can be constructively interpreted as a sign of supply drying up during consolidation, it could also reflect a lack of sufficient buying pressure to challenge the highs decisively. Despite this ambiguity in volume, the coherence between the price structure and momentum indicators provides a solid foundation for the breakout framework.

Continuation: Directional Flow Assessment
The technical structure for BNB/USDC presents a plausible case for a bullish continuation. The primary directional flow is clearly upward, anchored by a sequence of higher highs and higher lows on the daily chart. This trend is well-supported by key moving averages, with the price holding comfortably above the D1 EMA50 (714.06). Momentum indicators reinforce this view; the D1 ADX at 34.43 signals a healthy trending market, while the D1 RSI at 57.81 reflects solid bullish control. This daily picture is further validated by a strongly aligned weekly chart, which provides a robust bullish context. The primary factor tempering this reading is the recent pullback from the 807.35 high, which has entered a consolidation phase. Furthermore, a negative D1 Volume Oscillator (-9.81) indicates that recent moves have not been backed by increasing conviction. Despite this consolidation and volume profile, the integrity of the underlying uptrend remains intact, making the continuation framework technically relevant.

Comparative Framework Verdict
In assessing the three technical frameworks for BNB/USDC, a clear hierarchy emerges based on the prevailing market conditions. Both the Breakout and Continuation frameworks are deemed 'plausible', while the Range/Rebound framework is considered 'borderline'. The Breakout framework is identified as dominant due to its alignment with the strong underlying trend, confirmed by a high ADX reading. It clearly defines the critical resistance at $807.35, presenting the current consolidation as a constructive pause before a potential upward thrust. The Continuation framework is a close secondary, sharing the same bullish thesis rooted in the established trend structure and supportive moving averages, though its validation trigger is less specific than the Breakout's high-water mark. The Range/Rebound framework is the weakest of the three. Its 'borderline' status reflects the inherent difficulty of establishing a stable range in a market that still exhibits strong directional characteristics. While it correctly identifies a robust support zone around $750-$755, the prevailing trend indicators suggest that any price action within this zone is more likely to be a temporary pullback than the start of a prolonged sideways market. The key element to watch will be the market's reaction to the $807 resistance. A decisive break would validate the dominant Breakout scenario, while a firm rejection could lend more credibility to the ranging hypothesis.
For broader market context, readers can also review the latest related fundamental analysis for this pair.
For live market monitoring and the full interactive chart, readers can access the dedicated BNB Market Hub.
Disclaimer
CopyTradia provides technical analysis for informational and educational purposes only. This content does not constitute financial advice, investment recommendations, or trading signals. Cryptocurrency markets are highly volatile. Past performance is not indicative of future results. Always conduct your own research (DYOR) and consult a qualified financial advisor before making any investment decisions.


