Bitcoin Trend Continuation: Analysis Below $81.5k

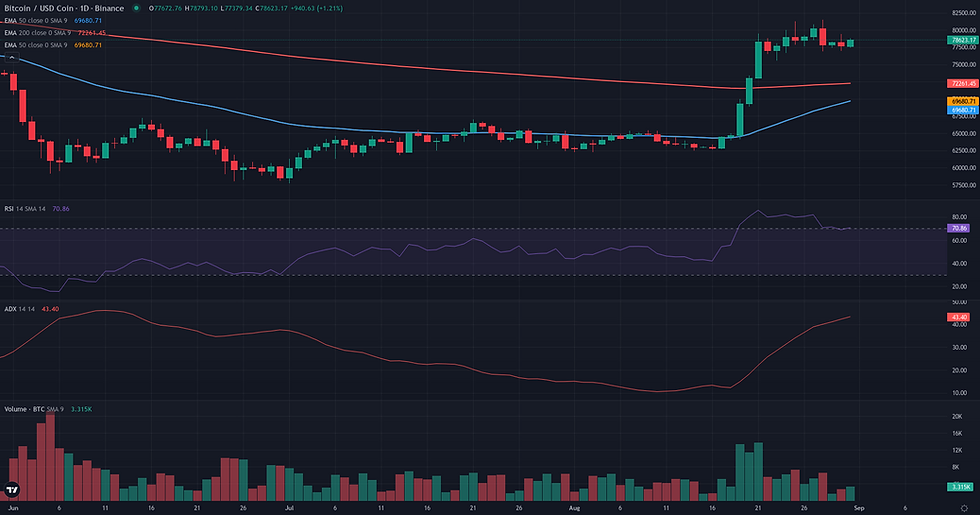
This Bitcoin trend continuation examines the current BTC/USDC structure in the context of support defense and weakening alternative frameworks. Bitcoin (BTC/USDC) is currently in a consolidation phase after a powerful uptrend carried the price to a recent high of approximately $81,500. The market's underlying strength remains evident, with the D1 ADX registering a high value of 42.30, confirming a robust and directional trend. The daily RSI sits at a strong 69.03, reflecting bullish momentum that has not yet reached extreme overbought territory. This current pullback from the highs is occurring on notably lower volume, suggesting a constructive pause rather than a reversal. This technical consolidation aligns with recent fundamental analysis pointing to a shift in market sentiment from high greed to a more tempered state, suggesting the market is digesting its recent significant advance. The current price action represents a critical juncture, testing whether the established uptrend has the strength to absorb recent profit-taking and prepare for its next move. This BTC technical analysis will explore three potential structural frameworks for the week ahead.

Range & Rebound: Market Structure Assessment
The Range/Rebound framework is evaluated as not plausible in the current market structure. The analysis reveals a market dominated by a strong, directional uptrend, as evidenced by a D1 ADX reading of 42.30, which is characteristic of a trending environment rather than a ranging or stabilization phase. Price recently achieved a significant high at 81,494.43 and is currently undergoing a minor pullback. The Range/Rebound framework is specifically designed to identify potential reversals from established support zones or within well-defined ranges after a bearish move. The current context is the opposite: a pause within a powerful bullish impulse. There is no identifiable range at these levels, and the price is not testing a long-term structural floor. For this framework to become relevant, a substantial market shift would be required, such as a deep correction that establishes a new support base, followed by a clear loss of downward momentum and signs of price stabilization at those lower levels.

Breakout: Structural Catalyst Assessment
The Breakout framework appears plausible as the market has developed a classic preparation structure below a significant resistance level. A powerful uptrend, confirmed by a high ADX D1 reading of 42.30, has carried the price to a clear ceiling at 81,494.43, which marks both the 20-day Donchian high and the weekly high. Following this test, the market has entered a consolidation phase characterized by a notable decrease in volume, as indicated by a Volume Oscillator of -25.82. This pattern of a high-conviction move followed by a low-volume pause is structurally sound, suggesting accumulation rather than distribution. The weekly context reinforces this reading, with the price finding support near the W1 EMA 50 at 77,284.42. The main element tempering this view is the nature of the recent consolidation; it is a slight pullback from the highs rather than a tight flag, indicating a minor rejection that requires resolution. However, the balance of evidence, driven by the underlying trend strength and constructive volume signature, supports the plausibility of a breakout attempt.

Bitcoin Trend Continuation: Directional Flow Assessment
The technical structure for BTC/USDC presents a plausible continuation scenario. The primary daily trend is firmly established and bullish, a reading strongly supported by an ADX D1 value of 42.30, which indicates a powerful, trending market. Price action remains well above key structural supports like the D1 EMA 50 (69315.66), reinforcing the directional bias. This daily strength is contextualized by a recent and explosive weekly breakout, which saw the price clear significant prior resistance. The current market phase is best described as a consolidation or pullback following the recent peak at 81494.43. This pullback appears constructive for a continuation framework; notably, the Volume Oscillator D1 at -25.82 suggests this corrective price action is occurring on relatively low volume, which often precedes a resumption of the primary trend. However, some caution is warranted. The most recent weekly candle formed a notable upper wick after hitting its high, signaling the emergence of supply or profit-taking. Furthermore, the H1 micro-chart confirms a temporary loss of upward momentum. Despite these short-term pressures, the dominant D1 and W1 structures remain coherent and aligned in favor of a potential continuation.
Comparative Framework Verdict
Comparing the three technical frameworks, a clear hierarchy emerges with two plausible bullish scenarios against one invalid structure. The Continuation framework is assessed as the most dominant interpretation of the current market. It accurately captures the essence of the price action: a healthy, low-volume pullback within a powerful, established daily uptrend. Its validity is anchored to price holding above the recent weekly low support zone around $76,667, which would confirm the current dip as a constructive pause. Running a close second, the Breakout framework is also plausible and complements the continuation view. It focuses on the resolution of the current consolidation, identifying the recent high of $81,494 as the critical resistance. A sustained break above this level would serve as the trigger for the next leg of the uptrend. While both scenarios are coherent, the Continuation framework better describes the market's immediate state of consolidation. In stark contrast, the Range/Rebound framework is deemed not plausible. Its core requirement of a ranging market or a rebound from a significant support floor is fundamentally at odds with the current environment, which is defined by strong directional momentum. Therefore, the primary technical focus remains on whether the current pause resolves into a trend continuation, with the levels at ~$76,700 and ~$81,500 serving as the key structural boundaries to monitor.
For broader market context, readers can also review the latest related fundamental analysis for this pair.
For live market monitoring and the full interactive chart, readers can access the dedicated BTC Market Hub.
Disclaimer
CopyTradia provides technical analysis for informational and educational purposes only. This content does not constitute financial advice, investment recommendations, or trading signals. Cryptocurrency markets are highly volatile. Past performance is not indicative of future results. Always conduct your own research (DYOR) and consult a qualified financial advisor before making any investment decisions.


