Bitcoin Range Rebound Analysis: Support Tested

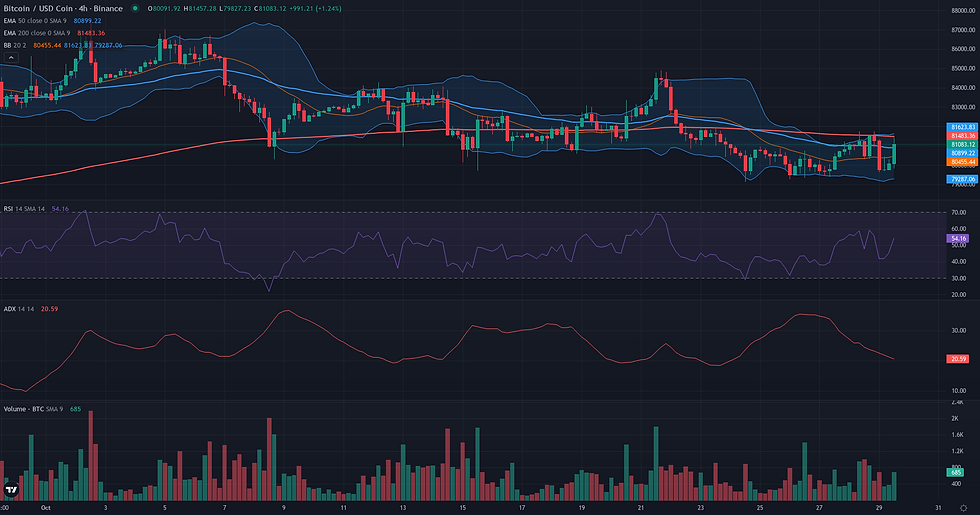
This Bitcoin range rebound analysis examines the current BTC/USDC structure in the context of support defense and weakening alternative frameworks. Bitcoin is currently in a state of consolidation, with the price trading around 81,273 USDC after failing to hold higher levels. The technical indicators on the daily chart confirm this lack of directional conviction. The Average Directional Index (ADX) is exceptionally low at 16.74, signaling a non-trending or ranging market environment. Concurrently, the Relative Strength Index (RSI) sits at a neutral 47.62, reflecting a balance between buying and selling pressure without a clear momentum advantage for either side. This technical picture of contained volatility and price contraction aligns with recent fundamental analysis, which noted a shift in broader crypto market sentiment to 'Neutral.' Structurally, the price is navigating a well-defined range, bounded by the recent weekly low near 79,132 USDC and resistance established at the weekly high of 84,876 USDC. The market's next move will likely depend on which of these boundaries is decisively broken.

Bitcoin Range Rebound Analysis: Support and Friction Zones
The Range/Rebound framework for BTC/USDC hinges on the market's reaction to the critical support area identified between 79130 and 79710 USDC. This zone, anchored by the recent weekly low, represents the foundation for a potential bounce. The framework would lose its technical coherence if this support fails decisively. An invalidation would be signaled by a daily close below 79132.68, which would not only break the current range structure but also open the possibility of a deeper correction towards the next significant weekly support level, the 50-week exponential moving average currently near 78565. For the rebound scenario to materialize, the price must navigate several layers of resistance. The first significant friction zone is an immediate cluster formed by the 50-day EMA (around 80768) and the daily pivot point (81110). Overcoming this area is the first test of bullish conviction. A further obstacle lies near the daily R1 pivot at 81912, a level that has recently capped upside attempts. Beyond that, the weekly R1 pivot at 83584 stands as a more substantial structural barrier. If the rebound successfully clears these hurdles, the logical technical projection would be a move toward the upper boundary of the established daily range. This resistance is located near the recent high of 87500, an area also highlighted by the weekly R2 pivot. A confirmation of the rebound's strength would involve a sustained move above the initial friction zone, while a weakening of the scenario would be indicated by a failure to break this resistance and a subsequent drift back towards the low end of the validation zone.

Breakout: Structural Catalyst Assessment
The Breakout framework for BTC/USDC currently presents a borderline case, characterized by a clear tension between its strong long-term uptrend and weakening short-term dynamics. On one hand, the market is in a high-level consolidation phase after a significant rally, with price holding firmly above key weekly moving averages like the W1 EMA 50. This macro context is classically favorable for a continuation breakout. However, the immediate daily structure tells a different story. Instead of coiling tightly under resistance, the price was recently rejected from the 84,876 USDC level, which marks the top of the recent range. This rejection is technically significant, and the subsequent price action has shown a lack of bullish conviction, with the D1 RSI dipping below the neutral 50 mark to 47.62 and price trading below its 20-day moving average (D1 BB middle at 81,846 USDC). The current market state, confirmed by a low D1 ADX of 16.74, is one of indecisive ranging rather than bullish preparation. For the breakout scenario to become plausible, buyers would need to reassert control by decisively pushing price back through the 84,876 USDC resistance zone.

Continuation: Directional Flow Assessment
The current market structure presents a borderline case for a bullish continuation. The primary supporting factor is the dominant weekly uptrend, which remains firmly in place with price holding significantly above key long-term moving averages like the W1 EMA50 (78565.37). From this higher timeframe perspective, the recent daily price action appears as a consolidation phase within a larger bullish structure. The pullback has so far been contained, with price managing to hold above the D1 EMA50 (80768.17), a positive sign for potential trend resumption. However, the 'Stable Directional Flow' required by the framework is currently absent on the daily timeframe. The market is in a state of pronounced indecision, characterized by a very low D1 ADX of 16.74, which signals a lack of any directional trend. This is corroborated by a D1 RSI of 47.62, indicating a pause in bullish momentum. Structurally, the price is caught in a narrow range between the aforementioned D1 EMA50 support and tactical resistance from the 4H EMA200 at 81760.29. This compression highlights the current equilibrium between buyers and sellers, making an immediate continuation uncertain. A clear resolution above this resistance, accompanied by a revival in momentum, would be required to shift the verdict from borderline to plausible.

Comparative Framework Verdict
Comparing the three technical frameworks, the Range/Rebound scenario emerges as the most plausible interpretation of the current market structure. This framework aligns directly with the observable data, particularly the very low daily ADX reading of 16.74, which strongly indicates a non-trending, range-bound market. Its validation is anchored to the price's interaction with the support zone identified between 79,130 and 79,710 USDC, an area currently being tested. In contrast, both the Continuation and Breakout frameworks are rated as borderline. Their plausibility is limited by the same core issue: they both presuppose a resumption of the broader weekly uptrend, a thesis that is not supported by the weak and indecisive momentum on the daily chart. The Continuation framework, which looks for a more immediate resumption of directional flow, is considered the secondary scenario. The Breakout framework is the weakest of the three; it requires a high-conviction move to break the range ceiling near 84,876 USDC, a scenario that seems distant given the current lack of buying pressure. The key element to monitor will be the market's reaction at the aforementioned support zone. A successful defense could validate the rebound thesis, while a failure would invalidate it and shift the technical outlook.
For broader market context, readers can also review the latest related fundamental analysis for this pair.
For live market monitoring and the full interactive chart, readers can access the dedicated BTC Market Hub.
Disclaimer
CopyTradia provides technical analysis for informational and educational purposes only. This content does not constitute financial advice, investment recommendations, or trading signals. Cryptocurrency markets are highly volatile. Past performance is not indicative of future results. Always conduct your own research (DYOR) and consult a qualified financial advisor before making any investment decisions.


