Bitcoin Range Rebound Analysis: $59k Support vs. Bearish Trend
- CopyTradia Intelligence

- Jun 8
- 5 min read
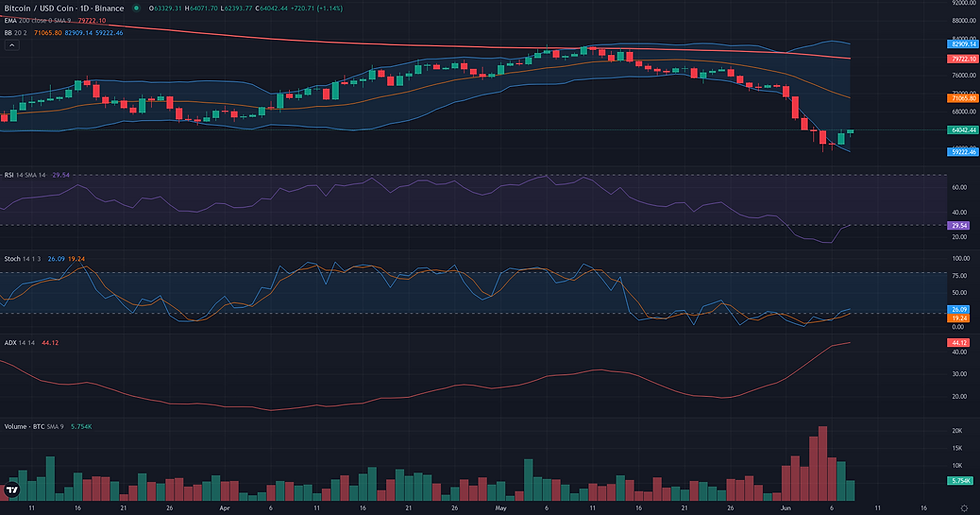
This Bitcoin range rebound analysis examines the current BTC/USDC structure in the context of support defense and weakening alternative frameworks. Bitcoin (BTC/USDC) is currently attempting a technical recovery after a severe price decline pushed it to a weekly low of $59,108. The market structure is defined by a sharp conflict between short-term buying pressure and a powerful, established downtrend. The daily ADX reading of 43.40 confirms the strength of this underlying bearish trend, with the price trading significantly below key long-term moving averages like the weekly 200-period EMA. However, the recent drop also drove the daily RSI deep into oversold territory at 26.60, creating the conditions for the current rebound. This technical battle at key support unfolds against a backdrop of 'Extreme Fear' in the broader market, as highlighted by recent fundamental analysis, with heightened realized volatility underscoring the precariousness of the current price level. The following analysis examines three distinct technical frameworks—Range/Rebound, Breakout, and Continuation—to map out the potential resolutions to this structural tension.

Bitcoin Range Rebound Analysis: Support and Friction Zones
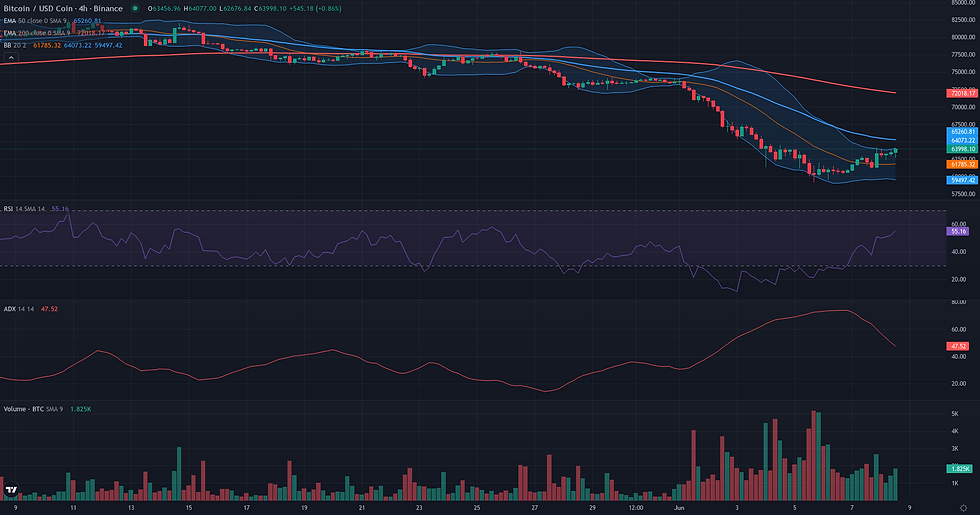
Following the defense of key supports, the Range/Rebound framework for BTC/USDC is now defined by a clear set of resolution zones originating from the validation area of [59108.62, 60070.33]. This zone marks the low point where significant buying pressure emerged, confirmed by a daily bullish engulfing pattern. The invalidation of this rebound scenario is structurally anchored. A daily close below the swing low of 59108.62 USDC would signify a complete failure of the support, breaking below the daily S2 pivot and likely triggering a continuation of the preceding downtrend. For the rebound to progress, it must overcome several friction zones. The first immediate obstacle is the resistance cluster between the recent 4H high of ~64,211 USDC and the D1 R1 pivot at 64,777.95 USDC. A more formidable barrier lies at the weekly pivot point of 65,482.51 USDC, a level that often dictates the medium-term balance of power. Beyond that, the weekly EMA 200 at 69,185.78 USDC stands as a major macro resistance. If the framework confirms by breaking these barriers, technical projection zones come into focus. The first significant target would be the weekly R1 pivot at 71,856.41 USDC. A more ambitious but plausible projection, representing a substantial mean reversion, is the daily EMA 50 at 73,274.75 USDC. Confirmation of the rebound's strength would involve a sustained hold above the weekly pivot, while a rejection from the initial resistance and a fall below the daily pivot (62,755.64) would serve as a primary weakening signal.
Breakout: Structural Catalyst Assessment
The Breakout framework is assessed as not plausible for the current market structure. The primary condition for this framework—a period of price compression or consolidation beneath a well-defined resistance—is absent. Instead, the daily chart reveals a strong and sustained downtrend, with price having fallen from above 82,000 to a recent low of 59,108.62. This bearish momentum is confirmed by a high D1 ADX reading of 43.40, indicating a powerful trend, while the D1 RSI at 26.60 signals deeply oversold conditions rather than building strength. The weekly context reinforces this reading, as the price has recently violated the critical W1 EMA 200 at 69,185.78, a significant long-term bearish development. The market is currently in a breakdown phase, not a breakout preparation. For the Breakout framework to become relevant, the current downtrend would first need to terminate, followed by the formation of a stable price base and subsequent pressure against a new, identifiable resistance ceiling.

Continuation: Directional Flow Assessment
The technical structure for BTC/USDC presents a plausible case for a bearish continuation. A powerful downtrend has been established on the daily chart, with price having fallen from over 80,000 to below 60,000. This directional move is characterized by its strength, as indicated by a high D1 ADX of 43.40, and is supported by significant volume on the decline. The price is currently trading well below key structural moving averages like the D1 EMA50 (73,274.75), reinforcing the bearish control. This daily structure receives strong confirmation from the weekly timeframe. A critical development is the recent weekly close below the W1 EMA200 (69,185.78), a long-term benchmark that often signals a major regime shift. This alignment between the daily trend and a weekly structural breakdown provides a coherent basis for anticipating further downside. However, the reading is not without nuance. The market is currently experiencing a sharp rebound from the 59,108.62 low, evidenced by a bullish engulfing pattern on the last daily candle and an oversold D1 RSI at 26.60. This suggests the downward momentum is temporarily exhausted, and a corrective bounce is in progress. The plausibility of the continuation framework hinges on this bounce remaining corrective and failing to reclaim key prior support levels.

Comparative Framework Verdict
Comparing the three technical frameworks reveals a clear tension between the immediate price action and the dominant underlying trend. The Range/Rebound and Continuation scenarios are both deemed plausible, while the Breakout framework is not applicable to the current market structure. The Range/Rebound framework emerges as the most dominant scenario for the immediate term. It accurately captures the current market behavior: a sharp bounce from the validation zone between $59,108 and $60,070, which was supported by oversold momentum indicators and a daily bullish engulfing candle. This framework provides a clear map of the potential for a relief rally, defining the key resistance levels that must be overcome for it to gain traction. Considered secondary, the bearish Continuation framework remains highly relevant. Its plausibility is anchored in the powerful daily and weekly downtrends, most notably the structural breakdown below the weekly 200-period EMA. This scenario represents the path of least resistance for the macro trend and would be validated if the current rebound fails to reclaim significant price levels. Finally, the Breakout framework is assessed as not plausible. The market is in a distinct downtrend, the opposite of the price compression and consolidation required for a breakout setup. The key element to monitor is the market's reaction to the initial friction zones identified in the rebound scenario, as this will provide the first major clue as to whether buying pressure is sustainable or if the larger bearish trend is set to resume.
For broader market context, readers can also review the latest related fundamental analysis for this pair.
For live market monitoring and the full interactive chart, readers can access the dedicated BTC Market Hub.
Disclaimer
CopyTradia provides technical analysis for informational and educational purposes only. This content does not constitute financial advice, investment recommendations, or trading signals. Cryptocurrency markets are highly volatile. Past performance is not indicative of future results. Always conduct your own research (DYOR) and consult a qualified financial advisor before making any investment decisions.


