Bitcoin Range Rebound Analysis: Daily Holds Against Bearish Pressure

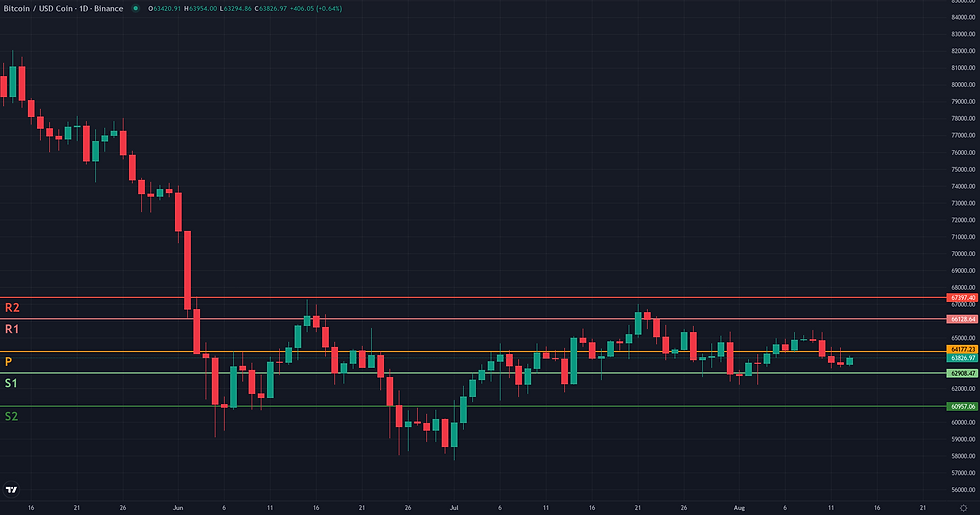
This Bitcoin range rebound analysis examines the current BTC/USDC structure in the context of support defense and weakening alternative frameworks. BTC/USDC is currently navigating a period of pronounced consolidation, with the price closing at 63,420.92 USDC. The daily chart clearly illustrates a market devoid of directional momentum, confirmed by an extremely low ADX reading of 10.89 and a neutral-to-weak RSI of 45.48. Price action remains contained within its recent weekly range, bounded by approximately 62,225 and 65,446 USDC, and sits below key short-term dynamic resistance like the 50-day EMA at 64,523 USDC. This technical consolidation aligns with the latest fundamental analysis, which points to a period of significantly suppressed volatility and balanced derivatives positioning, suggesting market indecision rather than a clear directional bias. The broader weekly context, however, remains bearish, with price trading well below major long-term moving averages, creating a structural tension between the daily range and the overarching trend.
Bitcoin Range Rebound Analysis: Support and Friction Zones
The resolution for this borderline Range/Rebound framework for BTC/USDC is anchored to the 62,225 - 62,909 USDC support zone. This area represents the lower boundary of the established daily range, and the market's behavior here will determine whether the D1 consolidation holds or gives way to the broader weekly downtrend. The primary invalidation condition for this rebound scenario is a decisive failure of this support. A daily close below the recent low of 62,225.83 would signal that the D1 range has broken down, likely triggering a continuation of the bearish trend observed on the weekly chart. Such a move would negate the rebound thesis entirely. For the rebound to confirm, it must navigate several layers of technical resistance. The first friction zone lies immediately above, around the D1 Pivot (63,702) and the D1 middle Bollinger Band/W1 Pivot cluster (64,054 - 64,177). Overcoming this area would be the first sign of a successful mean-reversion. A more significant test awaits at the D1 EMA 50 (64,523), a dynamic resistance that has historically capped recovery attempts. The final hurdle is the upper limit of the range itself, near 65,450. If the rebound successfully breaks out of the daily range, the first major projection zone is the Weekly R1 pivot at 66,128. A more optimistic target, representing a significant counter-trend rally, would be the major weekly resistance at the W1 EMA 200, located at 68,824. Conversely, the framework will show signs of weakening if the price fails to generate upward momentum from the support zone, grinding sideways or being repeatedly rejected by the first friction levels.


Breakout: Structural Catalyst Assessment
The Breakout framework is currently not plausible for BTC/USDC. The core requirement of this strategy—a period of price compression directly beneath a well-defined resistance—is absent from the current market structure. While a resistance zone can be identified between the 20-day Donchian high at 65,773 USDC and the July peak of 67,000 USDC, the price is not challenging this area. Instead, recent price action shows a decline from the middle of the month-long range, with the last close at 63,420 USDC, positioning it in the lower half of the Bollinger Bands. This lack of upward pressure is corroborated by momentum indicators. The D1 RSI at 45.48 signals weak momentum, while the D1 ADX at an extremely low 10.89 confirms a complete absence of a directional trend. Furthermore, the weekly context adds significant friction to any bullish scenario, as the price remains firmly below the W1 EMA 200 at 68,824 USDC, a major long-term resistance level. For a breakout to become plausible, the structure would need to change significantly, requiring price to first reclaim and then consolidate above the D1 EMA 50 (64,523 USDC) before building sustained pressure against the 65.8k-67k resistance ceiling.

Continuation: Directional Flow Assessment
The Continuation framework, which seeks to identify a stable directional flow, is not considered plausible in the current market structure. The primary reason for this assessment is the clear absence of a directional trend on the daily timeframe. The D1 ADX reading of 10.89 is exceptionally low and points to a state of consolidation and indecision, which is antithetical to the concept of continuation. Price action over the past month has been characterized by choppy, overlapping candles, effectively creating a range without sustained progress in either direction. This lack of direction is further reinforced by the D1 RSI, which at 45.48, indicates weak underlying momentum. From a broader weekly perspective, the market is trading below its W1 EMA 200 (68824.55), suggesting the context is a pause within a larger corrective or bearish structure, not a setup for bullish continuation. For this framework to become relevant, the market would first need to establish a clear directional bias by decisively breaking out of its current range, supported by a significant increase in momentum indicators.

Comparative Framework Verdict
Comparing the three strategic frameworks, the current market structure for BTC/USDC is dominated by consolidation, making trend-based scenarios implausible. The Range/Rebound framework is rated as borderline and emerges as the most relevant scenario. Its coherence stems from the undeniable lack of a trend on the daily chart, evidenced by an ADX below 11, which supports the idea of price oscillating between established boundaries. This framework identifies a potential rebound from the key support zone between 62,225 and 62,909 USDC. However, its plausibility is capped at borderline because any such rebound would act as a counter-trend move against the confirmed weekly downtrend, presenting significant structural resistance. In contrast, both the Breakout and Continuation frameworks are deemed not plausible. Their core premises—either a compression of price under resistance for a breakout or a stable directional flow for a continuation—are fundamentally contradicted by the market's current state. The extremely low daily ADX reading is the primary invalidating factor for both, as it signals a lack of the necessary directional energy. The price is neither building pressure for an upward break nor exhibiting any sustained trend to continue. Therefore, the market's immediate future hinges on the resolution of the daily range: a successful defense of support would validate the rebound thesis, while a failure would likely see the dominant weekly bearish trend reassert itself.
For broader market context, readers can also review the latest related fundamental analysis for this pair.
For live market monitoring and the full interactive chart, readers can access the dedicated BTC Market Hub.
Disclaimer
CopyTradia provides technical analysis for informational and educational purposes only. This content does not constitute financial advice, investment recommendations, or trading signals. Cryptocurrency markets are highly volatile. Past performance is not indicative of future results. Always conduct your own research (DYOR) and consult a qualified financial advisor before making any investment decisions.


