Bitcoin Range Rebound Analysis: Support Holds Amid Bear Trend

This Bitcoin range rebound analysis examines the current BTC/USDC structure in the context of support defense and weakening alternative frameworks. BTC/USDC is currently navigating a period of consolidation, with price action centered around the 63,500 USDC level after finding support near the weekly low of 62,230 USDC. The market structure remains under broader bearish pressure, trading below key long-term moving averages such as the daily 50-period EMA (64,690 USDC) and the weekly 200-period EMA (68,867 USDC). This lack of directional conviction is quantitatively confirmed by the daily ADX indicator, which sits at a very low 14.64, signaling a range-bound environment. Momentum is neutral, with the daily RSI hovering just below the 50 mark at 47.67. This technical consolidation aligns with the latest fundamental analysis, which describes a market characterized by contracting volatility and cautious sentiment, with the Fear & Greed index remaining in 'Fear'. The following analysis will explore three technical frameworks—a rebound from support, a potential breakout, and a trend continuation—to map out the current structural possibilities.
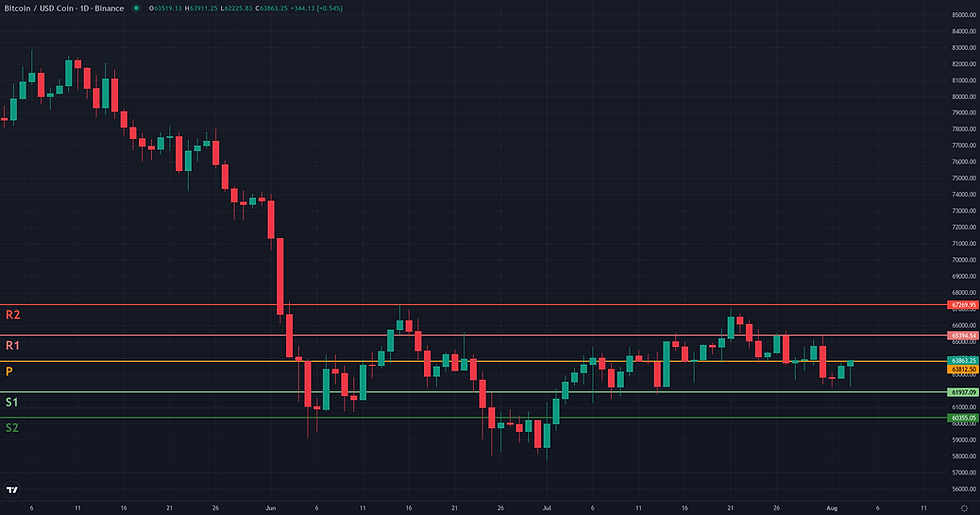
Bitcoin Range Rebound Analysis: Support and Friction Zones
Following the identification of a plausible range-rebound framework, the resolution analysis focuses on key structural levels that will determine its success or failure. The scenario is anchored on the defense of a critical daily support zone between 62,200 and 62,400 USDC, an area defined by recent price lows. The framework would lose its technical coherence if the price were to close on a daily basis below this support, as this would signal a failure of the stabilization and a probable resumption of the broader weekly downtrend. For the rebound to materialize, it must first overcome several layers of resistance. The initial friction zone lies between 63,300 and 63,800 USDC, an area containing both the daily and weekly pivots. A more formidable barrier is located between 64,700 and 65,400 USDC, where the D1 50-period EMA converges with the weekly R1 pivot. A decisive break above this cluster would serve as a strong confirmation that buyers are taking control. Conversely, a weakening of the framework would be indicated by a persistent failure to hold above 63,000 USDC, suggesting insufficient buying pressure. If the rebound successfully navigates these friction zones, higher technical reference points come into view. The first significant projection zone is the weekly R2 pivot around 67,270 USDC. A more ambitious target would be a test of the weekly 200-period EMA near 68,870 USDC. It is crucial to remember that this entire rebound scenario is a counter-trend play against a confirmed weekly downtrend, and the active bearish trend on the 4H chart (ADX 27.25) presents an immediate headwind.


Breakout: Structural Catalyst Assessment
The Breakout framework is assessed as not plausible for BTC/USDC at this time. The market structure fundamentally lacks the preconditions for a structural break to the upside. Instead of a compression phase, where price consolidates tightly beneath a key resistance, the daily chart shows a rejection from the recent high of 67000.00 (Donchian 20 D1 upper). Price is currently struggling below the EMA 50 D1, indicating a loss of short-term bullish control. This structural weakness is confirmed by key indicators. The D1 ADX, at a very low 14.64, signals a distinct lack of directional energy, while the D1 RSI at 47.67 points to neutral-to-bearish momentum. Furthermore, the negative Volume Oscillator (-15.33) highlights a general lack of buying interest. Zooming out, the weekly context provides a strong bearish headwind, with price trading below its 200-week moving average and weekly momentum indicators firmly in bearish territory. For this framework to become relevant, the market would need to reverse its current trajectory, establish a clear consolidation base below 67000.00, and demonstrate a significant build-up in both momentum and trend strength.

Continuation: Directional Flow Assessment
The Continuation framework is not retained for the current market structure, as the primary condition of a 'Stable Directional Flow' is absent. The daily chart reveals a market devoid of a clear trend, characterized by choppy, sideways price action. This lack of direction is quantitatively confirmed by the D1 ADX, which sits at a very low 14.64, signaling a consolidative or ranging environment rather than a trending one. Structurally, the price is in a weak position, trading below its D1 EMA50 (64690.74) and, more significantly, below the W1 EMA200 (68866.97), suggesting that the broader context remains unfavorable for a bullish continuation. Momentum indicators offer no support, with the D1 RSI at a neutral 47.67. For this framework to become plausible, the market would first need to establish a clear directional impulse, confirmed by a breakout from the recent range (roughly 62,200-67,000) and a corresponding rise in the D1 ADX to levels indicating a new trend is forming.

Comparative Framework Verdict
In the current market structure for BTC/USDC, the three technical frameworks present a clear hierarchy of plausibility. The Range/Rebound scenario stands out as the only coherent framework, directly aligning with the market's dominant characteristic: a distinct lack of directional trend. This is evidenced by a very low daily ADX reading, which supports the thesis of a consolidation phase anchored by a well-defined support zone between 62,200 and 62,400 USDC. Although this rebound scenario operates against a stronger, bearish weekly trend, its premises are well-supported by daily indicators suggesting momentum exhaustion. Conversely, both the Breakout and Continuation frameworks are assessed as not plausible. Their core requirement is the presence of directional energy or an established trend, both of which are fundamentally absent from the current market. The low ADX, neutral momentum, and choppy price action invalidate any thesis predicting an imminent, sustained move in either direction. Therefore, no secondary framework can be identified. The most critical dynamic to monitor is the resilience of the aforementioned daily support zone. The Range/Rebound framework would lose its validity with a daily close below this level, which would likely signal a capitulation to the prevailing weekly bearish pressure. Until then, the market structure favors sideways action and potential rotation within the established range.
For broader market context, readers can also review the latest related fundamental analysis for this pair.
For live market monitoring and the full interactive chart, readers can access the dedicated BTC Market Hub.
Disclaimer
CopyTradia provides technical analysis for informational and educational purposes only. This content does not constitute financial advice, investment recommendations, or trading signals. Cryptocurrency markets are highly volatile. Past performance is not indicative of future results. Always conduct your own research (DYOR) and consult a qualified financial advisor before making any investment decisions.


