Bitcoin Range Rebound Analysis: Price Consolidates

This Bitcoin range rebound analysis examines the current BTC/USDC structure in the context of support defense and weakening alternative frameworks. Bitcoin (BTC/USDC) is currently defined by a distinct consolidation phase, with the daily chart showing clear signs of a non-directional market. The price closed the daily session at 64,859.87, caught in a multi-week range. This sideways movement is technically confirmed by an extremely low D1 ADX reading of 10.83, which indicates a significant lack of trend momentum, while the D1 RSI sits neutrally at 54.25. This technical picture aligns with the latest market dynamics analysis, which highlights a period of suppressed volatility and consolidation. However, this daily range exists within a broader, structurally bearish weekly context. The price remains below key weekly moving averages, and the W1 ADX at 31.55 suggests the underlying downtrend is still active. This creates a tense equilibrium where the short-term lack of direction on the daily chart is at odds with persistent long-term bearish pressure, setting the stage for a potential resolution in either direction.
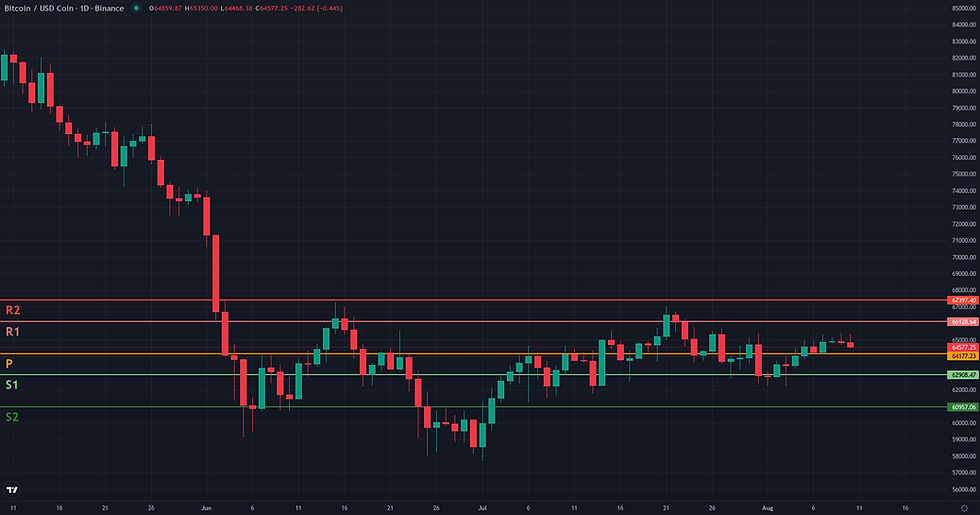
Bitcoin Range Rebound Analysis: Support and Friction Zones
Following the identification of a borderline Range/Rebound framework, the resolution analysis starts from the validation zone of 62,225 - 62,910 USDC. This zone represents the critical support base for the daily consolidation structure. The framework would lose all coherence and be invalidated if the price breaks down with a daily close below 62,225 USDC, as this would signal a failure of the range support and a probable continuation of the dominant weekly downtrend. Currently, the price has initiated a rebound from this support and is encountering its first layer of friction around the D1 50 EMA at 64,637.90. This level is a key dynamic pivot; a sustained move above it is required for the rebound to gain credibility. Should this first obstacle be cleared, a more significant friction zone awaits between the Weekly R1 pivot at 66,128.64 and the structural D1 highs near 67,000 USDC. This area constitutes the upper boundary of the established range. A confirmed rebound would involve a decisive breakout above this 67,000 USDC ceiling, opening up technical projections toward major long-term averages, starting with the W1 200 EMA at 68,824.55. Conversely, the framework would show signs of weakening if the price is rejected from the D1 50 EMA, especially on low volume, suggesting the rebound lacks the momentum to challenge the range top and may fall back to retest the validation zone.
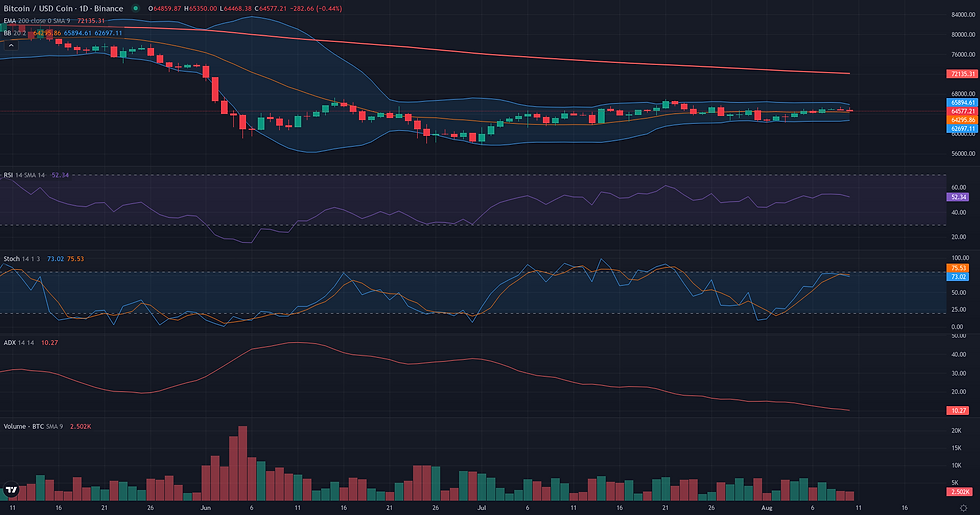

Breakout: Structural Catalyst Assessment
The Breakout framework for BTC/USDC presents a borderline case, characterized by a direct conflict between daily preparation and weekly resistance. On the daily chart, the structure is building a potential breakout scenario. Price action has been consolidating for several weeks below a clearly defined resistance at the 67000.00 level, the high of the last 20 days. This period of sideways movement is technically confirmed by a very low D1 ADX reading of 10.83, which signals a distinct lack of trend and often precedes a release of volatility. However, this constructive daily picture is heavily constrained by the weekly context. A breakout attempt would immediately confront the W1 EMA 200 at 68824.55, a major long-term resistance level. Furthermore, the underlying weekly momentum is weak, with a W1 RSI of 40.91. This creates a tense equilibrium: while the daily chart suggests energy is coiling for a move, the weekly chart indicates that any upward thrust faces a formidable structural ceiling, making the plausibility of a sustained breakout uncertain.

Continuation: Directional Flow Assessment
The Continuation framework is assessed as not plausible for BTC/USDC at this time. The primary reason for this conclusion is the absence of a clear directional trend on the daily chart, a fundamental prerequisite for a continuation scenario. The ADX D1 indicator, which measures trend strength, currently registers an extremely low value of 10.83, signaling a ranging and indecisive market structure rather than a 'Stable Directional Flow'. This lack of daily momentum is compounded by a bearish weekly context. Price is trading significantly below key long-term averages like the EMA 200 W1 (68824.55), and the weekly RSI (40.91) remains in bearish territory. Therefore, any attempt at a bullish continuation on the daily timeframe would be a counter-trend move against a stronger, bearish weekly structure. For this framework to become relevant, the market would first need to establish a clear directional bias, confirmed by the ADX rising above 20 and a decisive break of the current multi-week consolidation range.
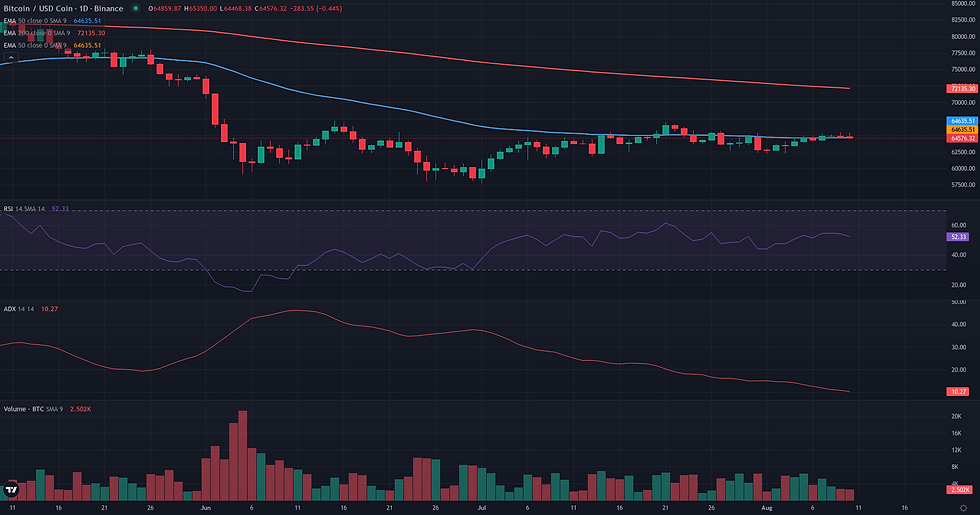
Comparative Framework Verdict
In assessing the three strategic frameworks for BTC/USDC, a clear hierarchy emerges based on the current market structure, which is dominated by a conflict between daily consolidation and a weekly downtrend. The Continuation framework is deemed not plausible. Its core requirement for a stable, directional trend is directly contradicted by the D1 ADX of 10.83, confirming the market is in a ranging, not a trending, state. The primary technical debate is between the Range/Rebound and Breakout frameworks, both of which are assessed as borderline. Each captures one side of the current consolidation but is weakened by the opposing pressure from the weekly timeframe. The Range/Rebound framework is identified as the dominant scenario. It most accurately describes the immediate price action: a bounce from the well-defined support zone between 62,225 and 62,910 USDC. This framework focuses on the internal dynamics of the established range. The Breakout framework is considered secondary; it outlines a potential future resolution where price challenges the range ceiling around 67,000 USDC. While plausible, it remains a more hypothetical scenario until significant buying pressure emerges. The key factor to monitor will be whether the current rebound can sustain momentum through immediate resistance or if it falters, giving more weight to the overarching bearish weekly structure.
For broader market context, readers can also review the latest related fundamental analysis for this pair.
For live market monitoring and the full interactive chart, readers can access the dedicated BTC Market Hub.
Disclaimer
CopyTradia provides technical analysis for informational and educational purposes only. This content does not constitute financial advice, investment recommendations, or trading signals. Cryptocurrency markets are highly volatile. Past performance is not indicative of future results. Always conduct your own research (DYOR) and consult a qualified financial advisor before making any investment decisions.


