Analyzing Bitcoin Market Dynamics Amidst Shifting Positioning
- CopyTradia Intelligence

- May 8
- 3 min read
Bitcoin concluded the week with a positive 7-day price change, extending its monthly gains, yet internal market signals suggest a nuanced picture. While price maintained an upward trajectory, volatility remained below its longer-term average, and speculative positioning showed signs of rebalancing, indicating a period of consolidation rather than aggressive directional conviction in Bitcoin market dynamics.
Bitcoin Price Performance and Volatility
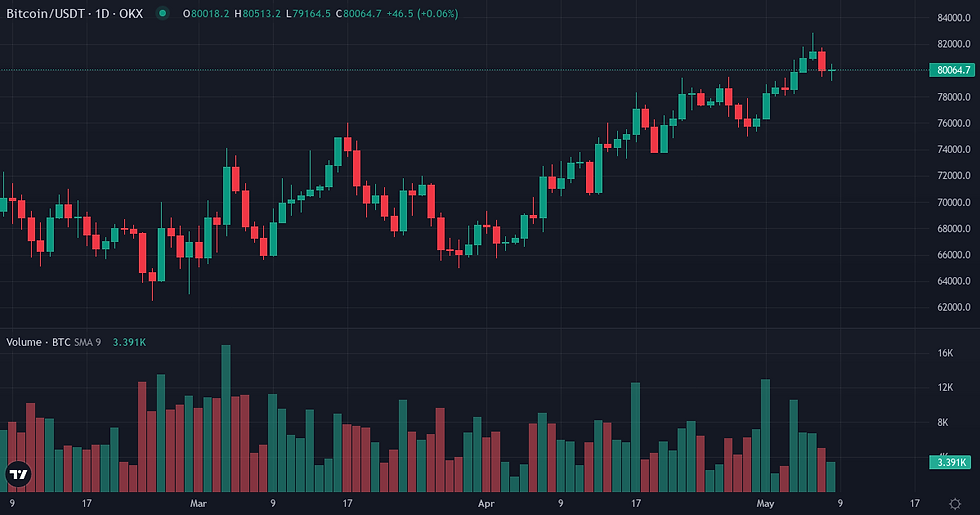
Bitcoin's price advanced by 2.53% over the past seven days, contributing to a 10.89% gain over the last 30 days, with the asset trading at $79,940. This upward movement occurred within a context of subdued volatility, as the 7-day realized volatility of 30.48% and 30-day realized volatility of 38.27% both remained below the 90-day baseline of 45.16%. Despite these gains, Bitcoin remains 36.60% below its all-time high of $126,080. As the benchmark asset, Bitcoin maintains a dominant position in the broader crypto market, holding 58.48% of the total market capitalization, which stands at $2.747 trillion. The 24-hour trading volume was $39.021 billion, with a volume momentum of 0.673, indicating a decrease in trading activity relative to the 7-day average.
Metric | Value |
BTC Price | $79,940 (-0.39% 24h / +2.53% 7d / +10.89% 30d) |
Volume 24h | $39.02B |
Native Quote Vol. 24h | $366.5M |
Market Cap | $1600.92B |
Market Cap Rank | 1 |
Circulating Supply | 20.03M BTC |
ATH Distance | 36.60% below ATH |
Metric | Value |
BTC/BTC Ratio | 1.00000 |
Relative Perf. 7d vs BTC | +0.00% |
Relative Perf. 30d vs BTC | +0.00% |
Derivatives Market: Open Interest and Funding
Open Interest for Bitcoin stood at $8.161 billion, marking a modest 0.49% increase over the past seven days, and remaining above the 90-day baseline of $6.397 billion. This indicates sustained, though not rapidly expanding, leveraged participation. The current funding rate was positive at 0.002415%, yet the 7-day cumulative funding rate was negative at -0.017592%, suggesting periods of short-term bearish pressure or profit-taking within the week. The 30-day funding Z-score of 1.5270, against a 30-day average of -0.003417%, points to a notable shift towards positive funding sentiment compared to the recent past. Liquidation data reveals a significant skew towards short liquidations, totaling $580.6 million (62.6%) over the last seven days, compared to $346.9 million (37.4%) in long liquidations. However, the 30-day average liquidation profile shows a more balanced directional skew, with long liquidations at 41.8%. The liquidation intensity remained low at 0.000579, suggesting that recent price movements did not trigger widespread cascading liquidations.

Metric | Value |
Funding Rate (current) | +0.0024% |
Funding Cumul. 7d | -0.0176% |
Open Interest | $8.16B (+0.49% 7d) |
Liq. 24h Longs | $9M |
Liq. 24h Shorts | $4M |
Liq. 7d Longs | $347M |
Liq. 7d Shorts | $581M |
Metric | Value |
Realized Vol 7d | +30.48% (90d avg: +45.16%) |
Realized Vol 30d | +38.27% |
Corr. BTC 30d | 1.0000 (90d avg: 1.0000) |
Beta vs BTC | 1.0000 |
Volume Momentum | 0.6728x |
Funding Z-Score 30d | 1.53σ |
Turnover Ratio | 0.0244 |
Liq. Intensity | 0.00058 |
Key Factors for the Upcoming Week
For the upcoming week, monitoring the coherence between price action and derivatives positioning will be key to understanding Bitcoin's trajectory. A sustained positive funding rate alongside expanding Open Interest, particularly if accompanied by an increase in trading volume, would suggest strengthening conviction behind the current price regime. Conversely, any significant increase in long liquidations, especially if the current positive funding rate reverses, could signal a shift in speculative sentiment and an unwinding of leveraged long positions. Furthermore, the broader macro environment, with pending US employment data including Non-Farm Employment Change and Unemployment Rate, could introduce external volatility. A deviation from expectations in these economic indicators might influence overall market risk appetite, potentially impacting Bitcoin's capital flows and its ability to maintain its current price levels.
Indicator | Value | Variation |
Broad Dollar Index | 118.39 | flat (7d) |
Fed Balance Sheet | $6710B | +$9,555M (7d) |
M2 Money Supply | $22,686B | +$58.7B (1m) |
Fear & Greed | 38 (Fear) | -1 pts (7d) |
Fear & Greed Index: Alternative.me
Bitcoin Weekly Takeaway
Bitcoin concluded the week in a state of measured advance, characterized by positive price performance and lower-than-average volatility. The underlying speculative positioning, while showing a recent positive shift in funding, indicates a market that is not aggressively extending leverage but rather rebalancing. The dominance of short liquidations over the past week suggests that recent price moves caught short-biased participants off guard, yet the overall liquidation intensity remains low. This suggests that the current upward trend is not driven by excessive speculative heat but by more contained dynamics. For swing traders, the current environment points to a market seeking to consolidate recent gains, with internal tensions in derivatives needing careful observation for signs of either renewed momentum or a potential pause.
Disclaimer
This article provides a fundamental analysis of Bitcoin's market dynamics based on available data and should not be construed as investment advice or a recommendation to buy or sell any asset.

Comments