Bitcoin Breakout Analysis: Consolidation Below $87.4k Resistance

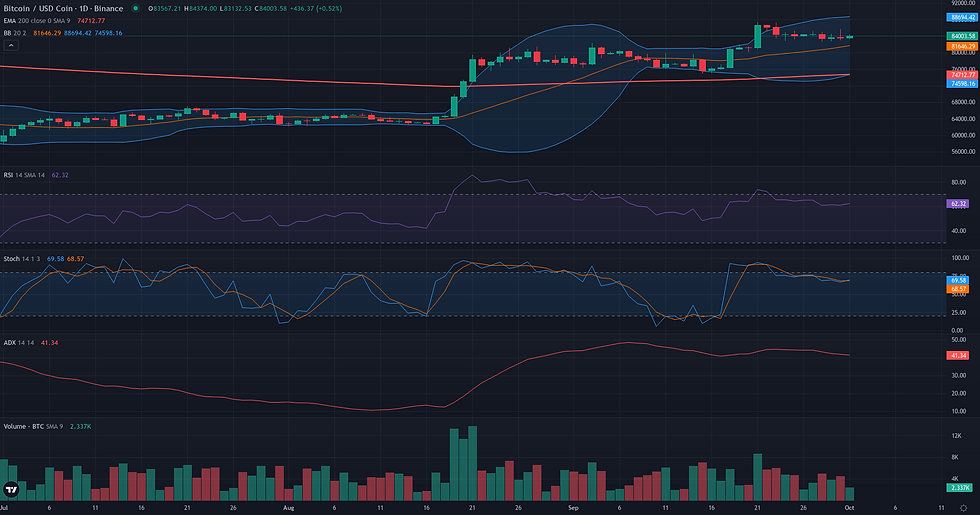
This Bitcoin breakout analysis examines the current BTC/USDC structure in the context of support defense and weakening alternative frameworks. Bitcoin (BTC/USDC) is currently in a phase of high-level consolidation after a strong bullish impulse pushed the price to a recent peak of 87,397.14. The latest daily close at 83,567.21 positions the asset well above key long-term moving averages, confirming a robust underlying uptrend. Market dynamics show a strong directional trend, evidenced by a daily ADX reading of 36.51, while the daily RSI at 60.89 indicates healthy bullish momentum without being in overbought territory. This technical pause aligns with recent fundamental analysis, which points to a market digesting recent gains amid elevated volatility and a sentiment shift from extreme greed to a more tempered state. The current structure, characterized by a tightening weekly range between 80,841.54 and 87,397.14, sets the stage for a potential resolution as the market decides its next directional move.

Range & Rebound: Market Structure Assessment
The Range/Rebound framework is assessed as not plausible in the current market context. This conclusion is based on a fundamental mismatch between the framework's core premise—identifying a controlled reversal or stabilization at a support level—and the observed price action. The daily chart reveals a period of high-level consolidation following a strong bullish impulse that peaked at 87,397.14. This is not a structure of stabilization after a decline. Key indicators corroborate this reading: the D1 ADX at 36.51 signals a strong, ongoing trend, while the D1 RSI at 60.89 reflects bullish momentum rather than the oversold conditions typically preceding a rebound. Furthermore, the weekly context reinforces this view, with price action challenging the upper Bollinger Band. For the Range/Rebound framework to become relevant, the market would first need to undergo a significant corrective phase, establishing a clear support zone and showing signs of bearish momentum exhaustion. The current structure is more aligned with a bullish continuation pattern than a bottoming formation.
Bitcoin Breakout Analysis: Structural Catalyst Assessment
The Breakout framework appears technically plausible for BTC/USDC, centered around a well-defined structural resistance. The market established a significant high at 87,397.14 on September 21st, a level which now serves as the primary ceiling and the upper band of the daily Donchian channel. Following this sharp upward thrust, price action has entered a constructive consolidation phase, trading in a tighter range for over a week. This pattern of an impulse wave followed by compression is a classic precursor to a potential continuation. The underlying market dynamics strongly support this reading. The daily trend is robust, as indicated by an ADX of 36.51, while the RSI at 60.89 shows healthy bullish momentum without being overextended. Furthermore, the declining volume during this consolidation (Volume Oscillator at -7.31) suggests a lack of selling pressure, reinforcing the idea of energy accumulation. This daily setup is corroborated by the weekly chart, where a strengthening uptrend is also evident (ADX W1 at 26.92), providing a favorable broader context for a potential structural break to the upside.

Continuation: Directional Flow Assessment
The Continuation framework appears technically plausible for BTC/USDC, supported by a coherent bullish structure on both daily and weekly timeframes. The market recently printed a strong impulsive move to a high of 87,397.14, followed by a period of orderly consolidation. This pullback has so far held above key structural zones, notably the W1 S1 pivot at 81,063.49, and is occurring on diminishing volume (Volume Oscillator D1: -7.31), which typically suggests the dominant trend is pausing rather than reversing. Momentum indicators reinforce this reading: the D1 ADX at 36.51 signals a strong, established trend, while the D1 RSI at 60.89 indicates bullish momentum with room to grow. The weekly context provides a solid tailwind, with price action firmly established in an uptrend above its key moving averages. The current price is hovering just below the Weekly Pivot (84,230.32), a level that now acts as the immediate hurdle for the continuation to materialize.

Comparative Framework Verdict
Comparing the three strategic frameworks, the analysis reveals a clear divergence between bullish and ranging scenarios. Both the Breakout and Continuation frameworks are deemed plausible, while the Range/Rebound framework is assessed as not plausible. This strong consensus points towards a market structure that favors an eventual move to the upside. The Breakout framework is identified as the dominant scenario. It provides the most precise definition of the current market state, focusing on the critical resistance at 87,397.14. A decisive move above this level would confirm the end of the current consolidation and signal the resumption of the primary uptrend. The Continuation framework is a strong secondary, sharing the same bullish bias. It describes the broader market context of an orderly pullback within a powerful trend, with validation centered on holding above the weekly pivot at 84,230.32. Conversely, the Range/Rebound framework is invalidated by the prevailing market conditions; the strong trend and bullish momentum are antithetical to its premise of stabilization at a support low. Monitoring price action relative to the 87,397.14 resistance will be key to assessing the market's next directional commitment.
For broader market context, readers can also review the latest related fundamental analysis for this pair.
For live market monitoring and the full interactive chart, readers can access the dedicated BTC Market Hub.
Disclaimer
CopyTradia provides technical analysis for informational and educational purposes only. This content does not constitute financial advice, investment recommendations, or trading signals. Cryptocurrency markets are highly volatile. Past performance is not indicative of future results. Always conduct your own research (DYOR) and consult a qualified financial advisor before making any investment decisions.


